\n
## Diagram: Tetrahedral State Space Visualization
### Overview
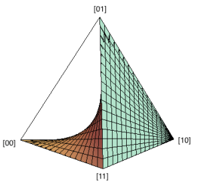
The image displays a three-dimensional tetrahedral diagram with a colored surface plot inside. The tetrahedron's four vertices are labeled with binary pairs, suggesting a representation of a four-state system, possibly related to quantum computing (qubit states), information theory, or a probability simplex. A curved, grid-lined surface fills the interior, colored with a gradient that appears to map a scalar value across the space defined by the vertices.
### Components/Axes
* **Structure:** A wireframe tetrahedron (a pyramid with a triangular base).
* **Vertices (Labeled):**
* Top vertex: `[01]`
* Bottom-left vertex: `[00]`
* Bottom-right vertex: `[10]`
* Bottom-center vertex (front): `[11]`
* **Internal Surface:** A continuous, curved surface with a visible grid mesh. The surface is not flat; it appears to be a function or distribution plotted within the tetrahedral domain.
* **Color Scale:** The surface uses a color gradient. The area near vertex `[00]` is a deep red/orange, transitioning through yellow and green to a teal/cyan color near vertices `[01]` and `[10]`. The region near `[11]` appears to be a darker green or brown. This gradient likely represents the magnitude of a value (e.g., probability, energy, fidelity) at each point in the space.
### Detailed Analysis
* **Spatial Grounding & Labels:** The labels are placed directly at the four corners of the tetrahedron. There are no axis titles, legends, or numerical scales present. The only text is the four binary vertex labels.
* **Surface Topology:** The surface is not uniform. It appears to be highest (closest to the viewer) and most intensely colored (red) near the `[00]` vertex. It then curves downward and away, becoming greener as it approaches the plane defined by `[01]`, `[10]`, and `[11]`. The grid lines follow this curvature, emphasizing the three-dimensional shape.
* **Color-Value Relationship:** Assuming a standard heatmap convention, the red color near `[00]` indicates a high value, while the green/teal colors near `[01]` and `[10]` indicate lower values. The value at `[11]` is ambiguous but appears intermediate or low based on its darker hue.
### Key Observations
1. **Asymmetric Distribution:** The plotted surface is not symmetric with respect to the tetrahedron's vertices. It is heavily weighted toward the `[00]` state.
2. **Gradient Direction:** The primary color gradient flows from `[00]` (red/high) towards the opposite face formed by `[01]`, `[10]`, and `[11]` (green/low).
3. **Absence of Quantitative Data:** The diagram is purely qualitative. There are no numbers, tick marks, or a color bar legend to assign exact values to the colors or positions.
4. **Binary Notation:** The use of `[00]`, `[01]`, `[10]`, `[11]` strongly implies a system with two binary variables or a two-qubit system, where these labels represent the four possible computational basis states.
### Interpretation
This diagram visually represents a **scalar field or probability distribution over a four-state system**. The tetrahedron is a common way to visualize the state space of two qubits (a 4-dimensional Hilbert space projected into 3D) or the probability simplex for four outcomes.
* **What it Suggests:** The data suggests a strong bias or higher "value" (e.g., probability, population, correlation) associated with the `[00]` state. The system is most likely to be found in, or has the strongest property related to, this state. The states `[01]` and `[10]` have a lower, roughly similar value, while `[11]` may have a distinct, possibly intermediate value.
* **Relationships:** The surface defines a relationship between the four states. Moving away from `[00]` in the state space corresponds to a decrease in the plotted value. The curvature indicates this relationship is non-linear.
* **Potential Contexts:**
* **Quantum Computing:** Could visualize the population of qubit states after an operation, showing high fidelity to the `[00]` state.
* **Machine Learning:** Might represent the loss landscape or decision boundary for a classifier with four classes.
* **Statistics:** Could be a visualization of a multinomial probability distribution where one outcome (`[00]`) is dominant.
* **Anomaly/Notable Feature:** The most striking feature is the pronounced peak at `[00]`. Without additional context, it's unclear if this represents a desired outcome (e.g., successful state preparation) or an undesired one (e.g., a systematic error biasing results).
**Language Note:** All text in the image is in English (using binary numerals and square bracket notation). No other languages are present.