## 3D Pyramid Diagram: Binary Coordinate Hierarchy
### Overview
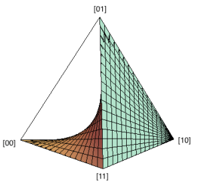
The image depicts a 3D pyramid (tetrahedron) with four vertices labeled using two-bit binary coordinates: [00], [01], [10], and [11]. The structure is divided into two color-coded regions: a red-shaded left half and a green-shaded right half, with a grid pattern overlaying the right side. The apex is labeled [01], while the base vertices are [00], [10], and [11].
### Components/Axes
- **Vertices**:
- [00] (bottom-left base)
- [01] (apex)
- [10] (bottom-right base)
- [11] (top-right base)
- **Color Coding**:
- Red: Left half of the pyramid (vertices [00], [01], [10])
- Green: Right half of the pyramid (vertices [01], [10], [11])
- **Grid Pattern**: Overlays the green-shaded right half, suggesting a coordinate or data matrix.
- **Edges**: Connect all vertices, forming a tetrahedral structure.
### Detailed Analysis
- **Binary Labels**:
- [00]: Binary "00" (0 in decimal)
- [01]: Binary "01" (1 in decimal)
- [10]: Binary "10" (2 in decimal)
- [11]: Binary "11" (3 in decimal)
- **Color Distribution**:
- Red dominates the left half, encompassing three vertices ([00], [01], [10]).
- Green dominates the right half, encompassing three vertices ([01], [10], [11]).
- **Grid Pattern**: The green-shaded region features a grid, implying a structured data layout (e.g., a 2x2 matrix or hierarchical subdivision).
### Key Observations
1. **Hierarchical Structure**: The pyramid’s apex ([01]) connects to all base vertices, suggesting a central node or root in a hierarchical system.
2. **Binary Coordinate System**: Labels indicate a 2-bit binary framework, potentially representing states, categories, or decision paths.
3. **Color Division**: The red-green split may denote opposing groups, data partitions, or operational states (e.g., active/inactive).
4. **Grid in Green Region**: The grid’s presence implies granular data organization within the right half, possibly a matrix or network.
### Interpretation
- **Technical Context**: The diagram likely represents a binary decision tree, hierarchical clustering, or a 2D coordinate system mapped to a 3D structure. The apex ([01]) could symbolize a root node or primary state, while the base vertices ([00], [10], [11]) represent subordinate or terminal states.
- **Color Significance**: The red-green division might indicate a binary classification (e.g., true/false, active/inactive) or a spatial partition in a dataset.
- **Grid Function**: The grid in the green region suggests a structured relationship between the binary labels, such as a lookup table or a network of dependencies.
- **Anomalies**: The apex ([01]) is shared between red and green regions, creating ambiguity in its classification. This could imply a transitional or neutral state.
This diagram emphasizes a binary framework with hierarchical and spatial relationships, potentially useful for modeling decision trees, data partitioning, or coordinate-based systems.