## Chart: Cumulative Distribution of Click-Through Probability
### Overview
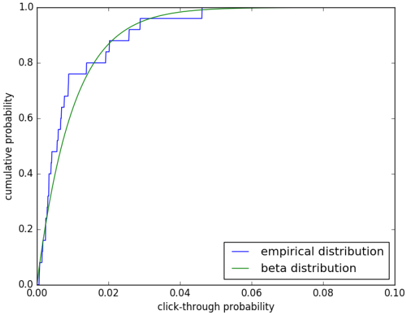
The image is a chart comparing the cumulative distribution of click-through probability for an empirical distribution and a beta distribution. The x-axis represents click-through probability, and the y-axis represents cumulative probability.
### Components/Axes
* **X-axis:** "click-through probability" with scale from 0.00 to 0.10 in increments of 0.02.
* **Y-axis:** "cumulative probability" with scale from 0.0 to 1.0 in increments of 0.2.
* **Legend:** Located in the bottom-right corner.
* Blue line: "empirical distribution"
* Green line: "beta distribution"
### Detailed Analysis
* **Empirical Distribution (Blue):** The empirical distribution is represented by a step function.
* At x=0.00, y=0.00
* At x=0.005 (approximately), y=0.08
* At x=0.01, y=0.25
* At x=0.015, y=0.40
* At x=0.02, y=0.55
* At x=0.025, y=0.70
* At x=0.03, y=0.78
* At x=0.035, y=0.90
* At x=0.04, y=0.95
* At x=0.05, y=0.98
* At x=0.10, y=1.00
The empirical distribution rises sharply initially and then gradually approaches 1.0.
* **Beta Distribution (Green):** The beta distribution is represented by a smooth curve.
* At x=0.00, y=0.00
* At x=0.005, y=0.25
* At x=0.01, y=0.45
* At x=0.015, y=0.60
* At x=0.02, y=0.70
* At x=0.025, y=0.78
* At x=0.03, y=0.85
* At x=0.035, y=0.90
* At x=0.04, y=0.93
* At x=0.05, y=0.97
* At x=0.10, y=1.00
The beta distribution also rises sharply initially and then gradually approaches 1.0, but it is smoother than the empirical distribution.
### Key Observations
* Both distributions show a rapid increase in cumulative probability for small values of click-through probability.
* The empirical distribution has a stepped appearance due to the discrete nature of the data.
* The beta distribution provides a smoothed representation of the cumulative probability.
* The beta distribution appears to be a good fit for the empirical distribution.
### Interpretation
The chart compares the cumulative distribution of click-through probabilities from an empirical dataset to a theoretical beta distribution. The empirical distribution represents the actual observed click-through rates, while the beta distribution is a model that attempts to fit the observed data. The close alignment of the two distributions suggests that the beta distribution is a reasonable model for the observed click-through probabilities. This can be useful for predicting future click-through rates or for comparing the performance of different advertising campaigns. The initial sharp rise in both distributions indicates that a large proportion of clicks occur at very low click-through probabilities.