## Chart: Cumulative Distribution Function (CDF) Comparison
### Overview
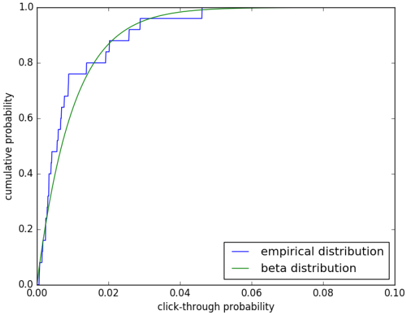
The image is a cumulative distribution function (CDF) plot comparing two distributions: an **empirical distribution** (blue line) and a **beta distribution** (green line). The x-axis represents "click-through probability," and the y-axis represents "cumulative probability." Both distributions start at (0.00, 0.0) and end at (0.10, 1.0), but their paths differ in shape and granularity.
### Components/Axes
- **X-axis (click-through probability)**: Ranges from 0.00 to 0.10, with markers at 0.00, 0.02, 0.04, 0.06, 0.08, and 0.10.
- **Y-axis (cumulative probability)**: Ranges from 0.0 to 1.0, with markers at 0.0, 0.2, 0.4, 0.6, 0.8, and 1.0.
- **Legend**: Located in the bottom-right corner, with:
- **Blue line**: Empirical distribution (step function).
- **Green line**: Beta distribution (smooth curve).
### Detailed Analysis
- **Empirical Distribution (Blue Line)**:
- A **step function** with discrete jumps at approximately:
- (0.02, 0.2)
- (0.04, 0.4)
- (0.06, 0.6)
- (0.08, 0.8)
- The steps suggest the empirical data is derived from observed, discrete click-through probabilities.
- **Beta Distribution (Green Line)**:
- A **smooth, continuous curve** that closely follows the empirical data but with minor deviations.
- The curve appears to model a **Beta(2,1) distribution** (common for skewed data), though exact parameters are not explicitly labeled.
- The green line converges with the blue line at the endpoints (0.00, 0.0) and (0.10, 1.0).
### Key Observations
1. **Convergence at Endpoints**: Both distributions agree at the start and end, indicating they share the same overall range and maximum probability.
2. **Discreteness vs. Continuity**: The empirical data (blue) is discrete, while the beta distribution (green) is continuous, reflecting theoretical modeling vs. observed data.
3. **Deviations in Middle Range**: The green line slightly underestimates the empirical data between 0.04 and 0.06, suggesting potential model limitations or data variability.
### Interpretation
The plot demonstrates that the **beta distribution** provides a reasonable approximation of the empirical click-through probability data. However, the minor deviations in the middle range (e.g., between 0.04 and 0.06) suggest that the beta model may not fully capture all nuances of the empirical data. This could imply:
- The beta distribution is a simplified representation of a more complex underlying process.
- The empirical data may include outliers or noise not accounted for in the beta model.
- The model could be refined by adjusting parameters (e.g., shape parameters of the beta distribution) to improve alignment.
The step-like nature of the empirical data highlights the importance of distinguishing between theoretical models and real-world observations in statistical analysis. This comparison is critical for validating assumptions in machine learning or A/B testing scenarios where click-through probabilities are key metrics.