## Bar Chart: KV Cache Length Comparison (Transformers vs DynTS)
### Overview
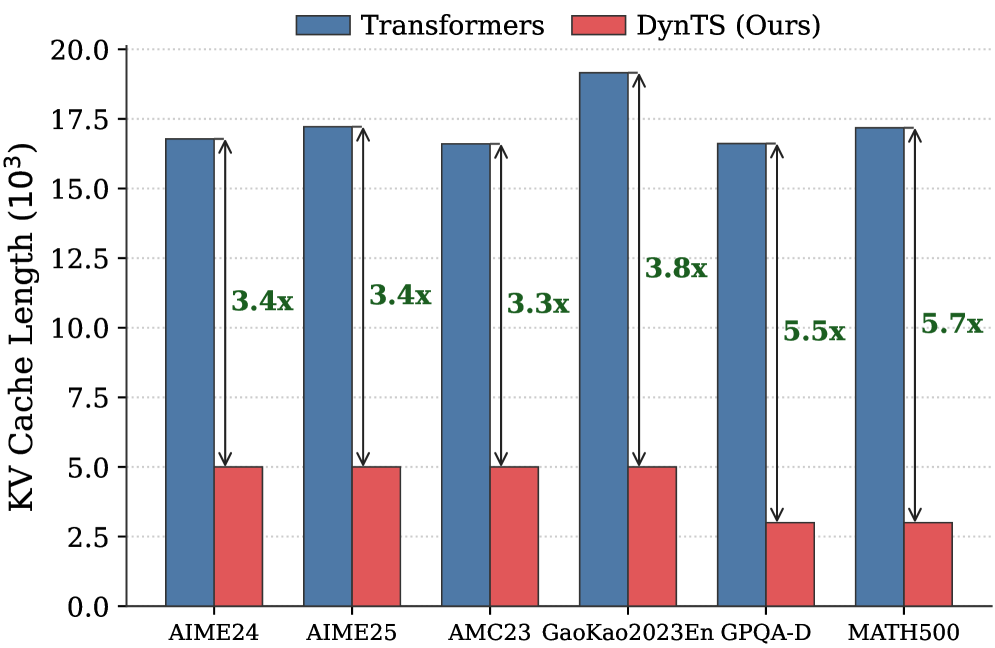
The chart compares KV Cache Length (in 10³ units) between two models: Transformers (blue bars) and DynTS (red bars) across six datasets. Each bar pair includes a multiplier indicating how many times larger the Transformer cache is compared to DynTS.
### Components/Axes
- **X-axis**: Datasets (AIME24, AIME25, AMC23, GaoKao2023En, GPQA-D, MATH500)
- **Y-axis**: KV Cache Length (10³ units), ranging from 0.0 to 20.0
- **Legend**: Top-center, with blue = Transformers, red = DynTS (Ours)
- **Annotations**: Multipliers (e.g., "3.4x") above each bar pair, indicating Transformer/DynTS ratio
### Detailed Analysis
| Dataset | Transformers (10³) | DynTS (10³) | Multiplier |
|-------------------|--------------------|-------------|------------|
| AIME24 | ~17.0 | ~5.0 | 3.4x |
| AIME25 | ~17.5 | ~5.0 | 3.4x |
| AMC23 | ~17.0 | ~5.0 | 3.3x |
| GaoKao2023En | ~19.0 | ~5.0 | 3.8x |
| GPQA-D | ~17.0 | ~3.1 | 5.5x |
| MATH500 | ~17.5 | ~3.1 | 5.7x |
### Key Observations
1. **Transformer Dominance**: Transformers consistently require 3–5.7x more KV Cache Length than DynTS across all datasets.
2. **Efficiency Gains**: DynTS achieves the highest efficiency (5.5–5.7x) in GPQA-D and MATH500, suggesting dataset-specific optimizations.
3. **Consistency**: Multipliers remain stable (3.3–3.8x) for most datasets except GPQA-D and MATH500, where efficiency gains spike.
### Interpretation
The data demonstrates that DynTS significantly reduces KV Cache Length compared to standard Transformers, with efficiency gains amplifying in complex reasoning tasks (GPQA-D, MATH500). This implies DynTS’s dynamic state management is particularly effective for multi-step reasoning, though the exact mechanisms (e.g., state pruning, attention optimization) would require deeper analysis. The near-identical Transformer cache sizes across datasets suggest uniform architectural overhead, while DynTS’s variable efficiency highlights its adaptability to task complexity.