## Line Chart: Effective Bandwidth and TPOT vs Offloading Ratio
### Overview
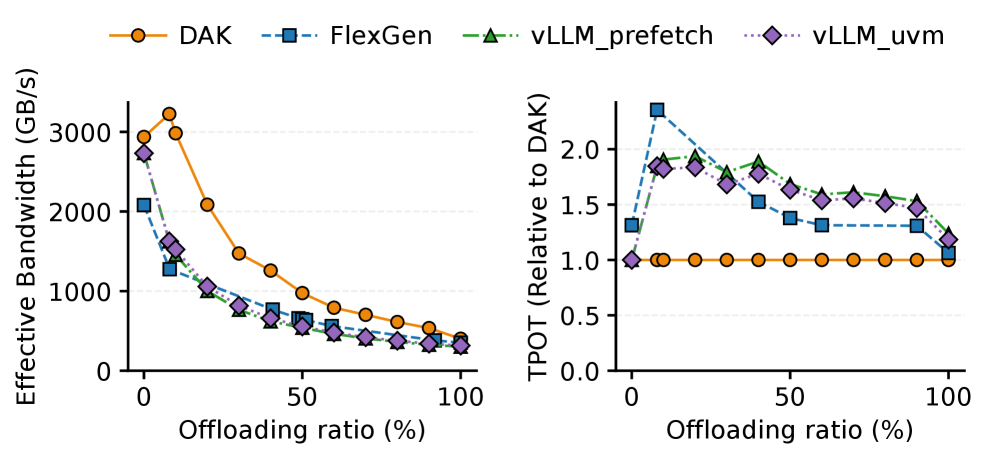
The image contains two side-by-side line charts comparing the performance of four computational methods (DAK, FlexGen, vLLM_prefetch, vLLM_uvm) across two metrics: **Effective Bandwidth (GB/s)** and **TPOT (Relative to DAK)** as a function of **Offloading Ratio (%)**. The charts reveal how computational efficiency and relative performance degrade with increasing offloading.
---
### Components/Axes
#### Left Chart: Effective Bandwidth (GB/s)
- **X-axis**: Offloading ratio (%) ranging from 0% to 100% in 10% increments.
- **Y-axis**: Effective Bandwidth (GB/s) from 0 to 3000.
- **Legend**:
- **DAK**: Orange circles (●)
- **FlexGen**: Blue squares (■)
- **vLLM_prefetch**: Green triangles (▲)
- **vLLM_uvm**: Purple diamonds (◆)
#### Right Chart: TPOT (Relative to DAK)
- **X-axis**: Offloading ratio (%) identical to the left chart.
- **Y-axis**: TPOT (Relative to DAK) from 0 to 2.0.
- **Legend**: Same color/marker scheme as the left chart.
---
### Detailed Analysis
#### Left Chart: Effective Bandwidth
1. **DAK (● Orange)**:
- Starts at ~3000 GB/s at 0% offloading.
- Drops sharply to ~500 GB/s at 100% offloading.
- Steep decline suggests high sensitivity to offloading.
2. **FlexGen (■ Blue)**:
- Begins at ~2000 GB/s at 0%.
- Declines gradually to ~300 GB/s at 100%.
- Less steep than DAK but still significant loss.
3. **vLLM_prefetch (▲ Green)**:
- Starts at ~1000 GB/s at 0%.
- Decreases to ~200 GB/s at 100%.
- Slower decline than DAK/FlexGen.
4. **vLLM_uvm (◆ Purple)**:
- Begins at ~1500 GB/s at 0%.
- Drops to ~250 GB/s at 100%.
- Intermediate decline rate between FlexGen and vLLM_prefetch.
#### Right Chart: TPOT (Relative to DAK)
1. **DAK (● Orange)**:
- Flat line at **1.0** across all offloading ratios (baseline).
2. **FlexGen (■ Blue)**:
- Starts at ~2.0 TPOT at 0% offloading.
- Decreases to ~1.2 TPOT at 100%.
- Maintains higher efficiency than DAK.
3. **vLLM_prefetch (▲ Green)**:
- Starts at ~1.5 TPOT at 0%.
- Declines to ~1.2 TPOT at 100%.
- Slightly less efficient than FlexGen.
4. **vLLM_uvm (◆ Purple)**:
- Begins at ~1.8 TPOT at 0%.
- Drops to ~1.3 TPOT at 100%.
- Most efficient relative to DAK at all offloading ratios.
---
### Key Observations
1. **Bandwidth Degradation**:
- All methods lose bandwidth as offloading increases, but DAK experiences the steepest decline.
- vLLM_uvm retains the highest bandwidth at 100% offloading (~250 GB/s vs. DAK’s ~500 GB/s).
2. **TPOT Efficiency**:
- FlexGen and vLLM_uvm consistently outperform DAK, with vLLM_uvm achieving the highest TPOT (~1.8 at 0% offloading).
- At 100% offloading, all methods converge to TPOT ~1.2–1.3, indicating similar relative efficiency.
3. **Trade-offs**:
- Higher offloading reduces absolute bandwidth but may improve relative efficiency (TPOT).
- vLLM_uvm balances bandwidth retention and efficiency better than other methods.
---
### Interpretation
The data demonstrates that **offloading reduces computational bandwidth** for all methods, with DAK being the most impacted. However, **vLLM_uvm** emerges as the most efficient approach, maintaining higher TPOT values (relative to DAK) across all offloading ratios. This suggests that vLLM_uvm optimizes resource usage better than DAK or FlexGen, particularly at higher offloading percentages. The convergence of TPOT values at 100% offloading implies diminishing returns in efficiency gains beyond a certain point. These trends highlight the importance of method selection based on workload requirements for bandwidth vs. computational efficiency.