# Technical Document Extraction: Analysis of Loss Metrics Across Methods
## Overview
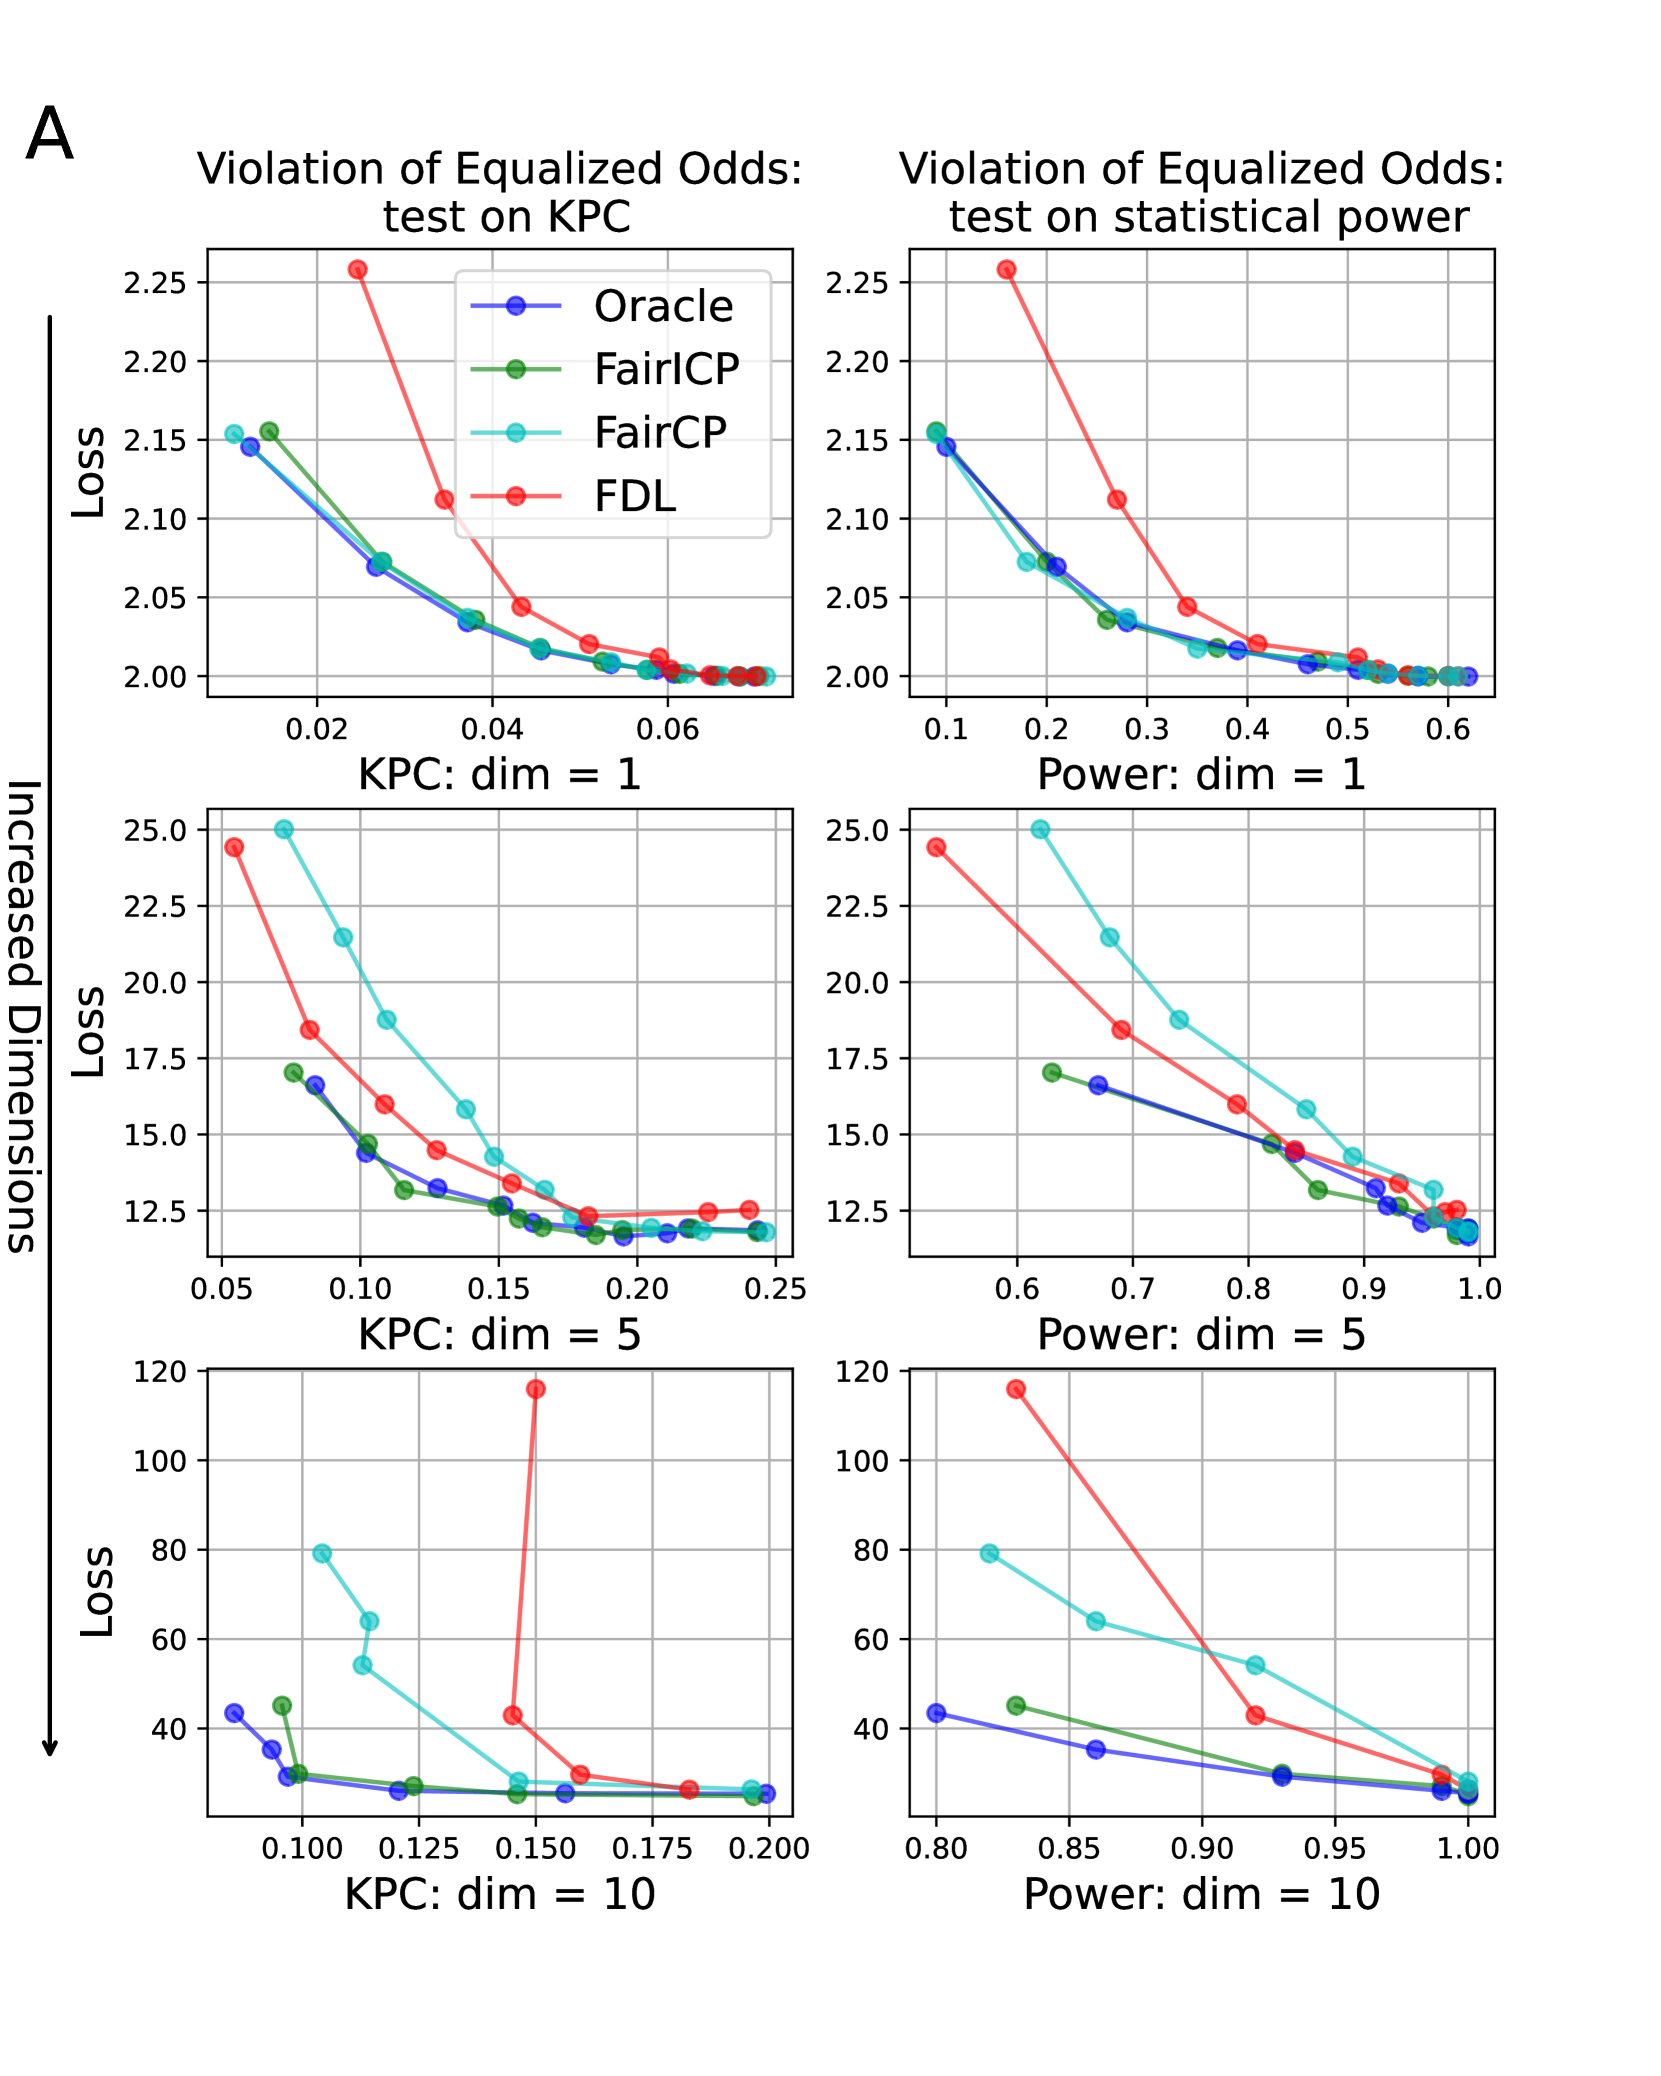
The image contains six subplots arranged in a 2x3 grid, comparing loss metrics across four methods (Oracle, FairICP, FairCP, FDL) under varying conditions. All subplots share a common y-axis labeled "Increased Dimensions" or "Loss," while x-axes vary by parameter (KPC dimensions, statistical power). The legend is positioned in the top-left corner of the grid.
---
### **Legend**
- **Oracle**: Blue line with circular markers
- **FairICP**: Green line with circular markers
- **FairCP**: Cyan line with circular markers
- **FDL**: Red line with circular markers
---
### **Subplot Analysis**
#### **Top Row**
1. **Left Subplot**
- **Title**: "Violation of Equalized Odds: test on KPC"
- **X-axis**: "KPC: dim = 1" (values: 0.02 → 0.06)
- **Y-axis**: "Increased Dimensions" (values: 2.00 → 2.25)
- **Trends**:
- All methods show a **downward trend** as KPC dimension increases.
- **FDL (red)** starts highest (~2.25) and drops sharply to ~2.00.
- **Oracle (blue)** and **FairICP (green)** converge near 2.00.
- **FairCP (cyan)** remains slightly above Oracle/FairICP.
2. **Right Subplot**
- **Title**: "Violation of Equalized Odds: test on statistical power"
- **X-axis**: "Power: dim = 1" (values: 0.1 → 1.0)
- **Y-axis**: "Increased Dimensions" (values: 2.00 → 2.25)
- **Trends**:
- Loss decreases as power increases for all methods.
- **FDL (red)** starts highest (~2.25) and drops steeply to ~2.00.
- **Oracle (blue)** and **FairICP (green)** remain stable near 2.00.
- **FairCP (cyan)** shows moderate decline.
---
#### **Middle Row**
3. **Left Subplot**
- **Title**: "KPC: dim = 5"
- **X-axis**: "KPC: dim = 5" (values: 0.05 → 0.25)
- **Y-axis**: "Loss" (values: 12.5 → 25)
- **Trends**:
- **FDL (red)** starts highest (~25) and drops sharply to ~12.5.
- **Oracle (blue)** and **FairICP (green)** converge near 12.5.
- **FairCP (cyan)** declines gradually.
4. **Right Subplot**
- **Title**: "Power: dim = 5"
- **X-axis**: "Power: dim = 5" (values: 0.6 → 1.0)
- **Y-axis**: "Loss" (values: 12.5 → 25)
- **Trends**:
- Loss decreases as power increases.
- **FDL (red)** starts highest (~25) and drops steeply to ~12.5.
- **Oracle (blue)** and **FairICP (green)** remain stable near 12.5.
- **FairCP (cyan)** shows moderate decline.
---
#### **Bottom Row**
5. **Left Subplot**
- **Title**: "KPC: dim = 10"
- **X-axis**: "KPC: dim = 10" (values: 0.100 → 0.200)
- **Y-axis**: "Loss" (values: 40 → 120)
- **Trends**:
- **FDL (red)** exhibits a **sharp spike** at x=0.150 (~120) before dropping to ~40.
- **Oracle (blue)** and **FairICP (green)** remain stable near 40.
- **FairCP (cyan)** declines gradually.
6. **Right Subplot**
- **Title**: "Power: dim = 10"
- **X-axis**: "Power: dim = 10" (values: 0.80 → 1.00)
- **Y-axis**: "Loss" (values: 40 → 120)
- **Trends**:
- Loss decreases as power increases.
- **FDL (red)** starts highest (~120) and drops steeply to ~40.
- **Oracle (blue)** and **FairICP (green)** remain stable near 40.
- **FairCP (cyan)** shows moderate decline.
---
### **Key Observations**
1. **Method Performance**:
- **FDL (red)** consistently shows the highest initial loss but steep declines in most subplots.
- **Oracle (blue)** and **FairICP (green)** exhibit the most stable performance across dimensions and power levels.
- **FairCP (cyan)** performs intermediately, with gradual declines.
2. **Dimensionality Impact**:
- Loss values increase with higher KPC dimensions (e.g., dim=10 subplots show higher loss ranges).
3. **Statistical Power Impact**:
- Higher power (closer to 1.0) correlates with lower loss across all methods.
---
### **Spatial Grounding**
- **Legend Position**: Top-left corner of the grid.
- **Axis Alignment**:
- X-axes vary by parameter (KPC dimensions, power) and dimension (1, 5, 10).
- Y-axes alternate between "Increased Dimensions" (top row) and "Loss" (middle/bottom rows).
---
### **Data Table Reconstruction**
| Method | KPC dim=1 (Loss) | KPC dim=5 (Loss) | KPC dim=10 (Loss) | Power dim=1 (Loss) | Power dim=5 (Loss) | Power dim=10 (Loss) |
|----------|------------------|------------------|-------------------|--------------------|--------------------|---------------------|
| Oracle | ~2.00 | ~12.5 | ~40 | ~2.00 | ~12.5 | ~40 |
| FairICP | ~2.00 | ~12.5 | ~40 | ~2.00 | ~12.5 | ~40 |
| FairCP | ~2.05 | ~13.0 | ~45 | ~2.05 | ~13.0 | ~45 |
| FDL | ~2.25 | ~25 | ~120 (spike) | ~2.25 | ~25 | ~120 |
---
### **Language Notes**
- All text is in **English**. No non-English content detected.