## Bar Chart: Data Source Weighting
### Overview
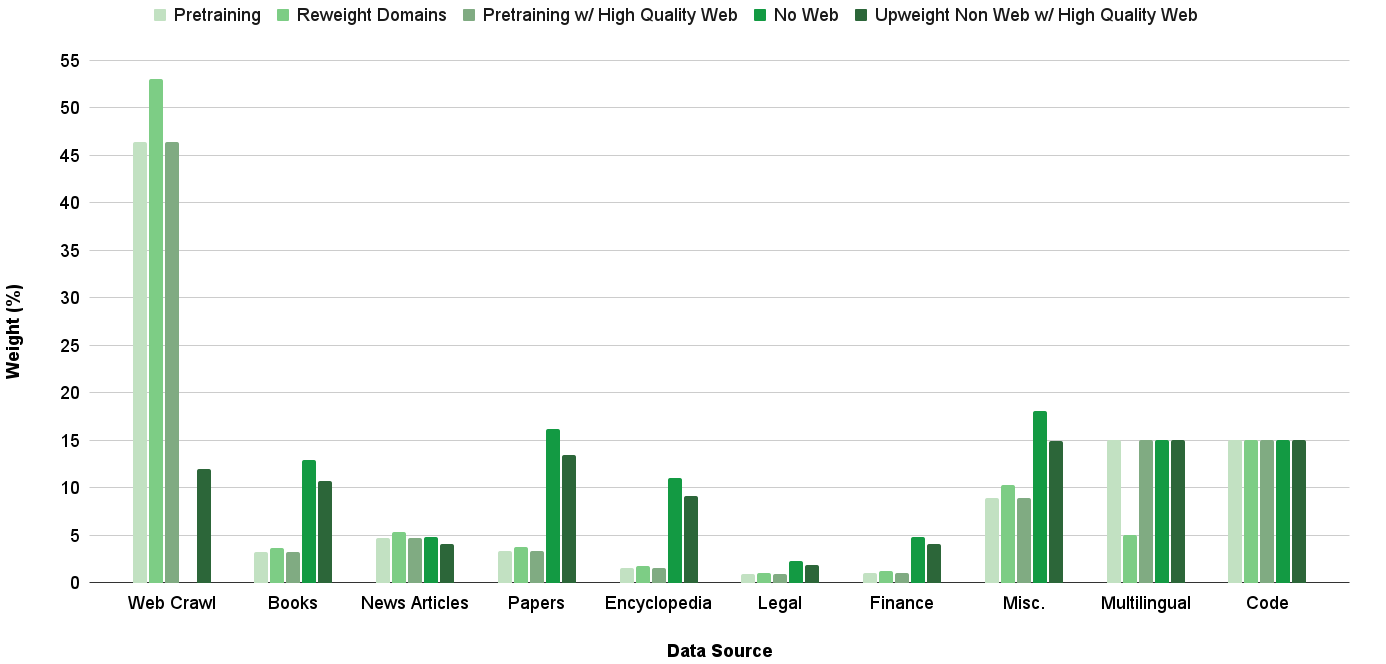
The image is a bar chart comparing the weights (%) of different data sources across five different training configurations: Pretraining, Reweight Domains, Pretraining with High Quality Web, No Web, and Upweight Non Web with High Quality Web. The x-axis represents the data source, and the y-axis represents the weight in percentage.
### Components/Axes
* **X-axis:** Data Source. Categories include: Web Crawl, Books, News Articles, Papers, Encyclopedia, Legal, Finance, Misc., Multilingual, Code.
* **Y-axis:** Weight (%). Scale ranges from 0 to 55, with increments of 5.
* **Legend:** Located at the top of the chart.
* Pretraining (light green)
* Reweight Domains (medium green)
* Pretraining w/ High Quality Web (green)
* No Web (dark green)
* Upweight Non Web w/ High Quality Web (darkest green)
### Detailed Analysis
Here's a breakdown of the weight percentages for each data source and training configuration:
* **Web Crawl:**
* Pretraining: ~46%
* Reweight Domains: ~53%
* Pretraining w/ High Quality Web: ~46%
* No Web: ~12%
* Upweight Non Web w/ High Quality Web: ~12%
* **Books:**
* Pretraining: ~3%
* Reweight Domains: ~4%
* Pretraining w/ High Quality Web: ~13%
* No Web: ~11%
* Upweight Non Web w/ High Quality Web: ~11%
* **News Articles:**
* Pretraining: ~5%
* Reweight Domains: ~5%
* Pretraining w/ High Quality Web: ~5%
* No Web: ~4%
* Upweight Non Web w/ High Quality Web: ~4%
* **Papers:**
* Pretraining: ~4%
* Reweight Domains: ~4%
* Pretraining w/ High Quality Web: ~16%
* No Web: ~13%
* Upweight Non Web w/ High Quality Web: ~13%
* **Encyclopedia:**
* Pretraining: ~2%
* Reweight Domains: ~2%
* Pretraining w/ High Quality Web: ~11%
* No Web: ~9%
* Upweight Non Web w/ High Quality Web: ~9%
* **Legal:**
* Pretraining: ~1%
* Reweight Domains: ~1%
* Pretraining w/ High Quality Web: ~3%
* No Web: ~2%
* Upweight Non Web w/ High Quality Web: ~2%
* **Finance:**
* Pretraining: ~1%
* Reweight Domains: ~1%
* Pretraining w/ High Quality Web: ~5%
* No Web: ~4%
* Upweight Non Web w/ High Quality Web: ~4%
* **Misc.:**
* Pretraining: ~9%
* Reweight Domains: ~10%
* Pretraining w/ High Quality Web: ~19%
* No Web: ~15%
* Upweight Non Web w/ High Quality Web: ~15%
* **Multilingual:**
* Pretraining: ~15%
* Reweight Domains: ~15%
* Pretraining w/ High Quality Web: ~15%
* No Web: ~15%
* Upweight Non Web w/ High Quality Web: ~15%
* **Code:**
* Pretraining: ~15%
* Reweight Domains: ~15%
* Pretraining w/ High Quality Web: ~15%
* No Web: ~15%
* Upweight Non Web w/ High Quality Web: ~15%
### Key Observations
* Web Crawl has the highest weight in Pretraining, Reweight Domains, and Pretraining w/ High Quality Web configurations.
* Multilingual and Code data sources have consistent weights across all training configurations.
* The "No Web" configuration generally has lower weights compared to other configurations, especially for Web Crawl.
* Pretraining w/ High Quality Web configuration tends to have higher weights for Books, Papers, Encyclopedia, Finance, and Misc. compared to Pretraining and Reweight Domains.
### Interpretation
The chart illustrates the relative importance (weight) of different data sources in various training configurations. The high weight of Web Crawl in the "Pretraining," "Reweight Domains," and "Pretraining w/ High Quality Web" configurations suggests that web-based data is crucial for initial model training. The consistent weights for "Multilingual" and "Code" across all configurations may indicate their consistent relevance regardless of the training approach. The "No Web" configuration's lower weights, particularly for "Web Crawl," highlight the significant impact of web data on the overall model. The "Pretraining w/ High Quality Web" configuration's increased weights for specific data sources like "Books," "Papers," and "Encyclopedia" suggest that incorporating high-quality web data can shift the model's focus towards more structured and curated information.