\n
## Bar Chart: Data Source Weighting for Different Training Approaches
### Overview
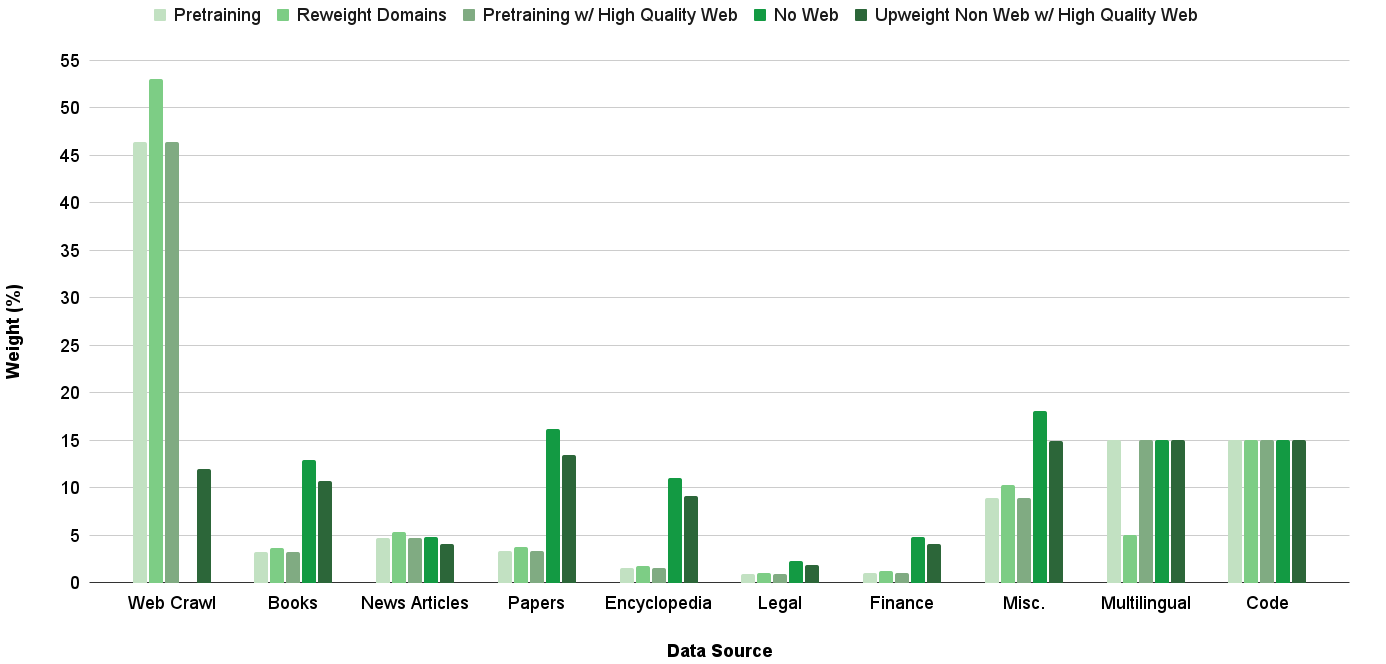
This bar chart visualizes the weighting (expressed as a percentage) of various data sources used in different pretraining and fine-tuning approaches. The x-axis represents the data source, and the y-axis represents the weight percentage. Five different training approaches are compared: Pretraining, Reweight Domains, Pretraining w/ High Quality Web, No Web, and Upweight Non Web w/ High Quality Web.
### Components/Axes
* **X-axis:** Data Source. Categories include: Web Crawl, Books, News Articles, Papers, Encyclopedia, Legal, Finance, Misc., Multilingual, Code.
* **Y-axis:** Weight (%). Scale ranges from 0 to 55, with increments of 5.
* **Legend:** Located at the top of the chart, horizontally aligned.
* Pretraining (Light Green)
* Reweight Domains (Medium Green)
* Pretraining w/ High Quality Web (Dark Green)
* No Web (Dark Gray)
* Upweight Non Web w/ High Quality Web (Medium Dark Green)
### Detailed Analysis
Here's a breakdown of the data for each data source and training approach, with approximate values:
* **Web Crawl:**
* Pretraining: ~47%
* Reweight Domains: ~11%
* Pretraining w/ High Quality Web: ~10%
* No Web: ~2%
* Upweight Non Web w/ High Quality Web: ~2%
* **Books:**
* Pretraining: ~11%
* Reweight Domains: ~13%
* Pretraining w/ High Quality Web: ~12%
* No Web: ~11%
* Upweight Non Web w/ High Quality Web: ~12%
* **News Articles:**
* Pretraining: ~6%
* Reweight Domains: ~6%
* Pretraining w/ High Quality Web: ~7%
* No Web: ~4%
* Upweight Non Web w/ High Quality Web: ~5%
* **Papers:**
* Pretraining: ~14%
* Reweight Domains: ~5%
* Pretraining w/ High Quality Web: ~15%
* No Web: ~8%
* Upweight Non Web w/ High Quality Web: ~10%
* **Encyclopedia:**
* Pretraining: ~11%
* Reweight Domains: ~10%
* Pretraining w/ High Quality Web: ~10%
* No Web: ~10%
* Upweight Non Web w/ High Quality Web: ~11%
* **Legal:**
* Pretraining: ~10%
* Reweight Domains: ~5%
* Pretraining w/ High Quality Web: ~6%
* No Web: ~10%
* Upweight Non Web w/ High Quality Web: ~8%
* **Finance:**
* Pretraining: ~2%
* Reweight Domains: ~2%
* Pretraining w/ High Quality Web: ~3%
* No Web: ~1%
* Upweight Non Web w/ High Quality Web: ~2%
* **Misc.:**
* Pretraining: ~7%
* Reweight Domains: ~15%
* Pretraining w/ High Quality Web: ~16%
* No Web: ~12%
* Upweight Non Web w/ High Quality Web: ~14%
* **Multilingual:**
* Pretraining: ~15%
* Reweight Domains: ~10%
* Pretraining w/ High Quality Web: ~10%
* No Web: ~15%
* Upweight Non Web w/ High Quality Web: ~15%
* **Code:**
* Pretraining: ~12%
* Reweight Domains: ~12%
* Pretraining w/ High Quality Web: ~12%
* No Web: ~12%
* Upweight Non Web w/ High Quality Web: ~13%
### Key Observations
* The "Pretraining" approach heavily relies on "Web Crawl" data, accounting for approximately 47% of the total weight.
* The "No Web" approach shows a relatively even distribution across several data sources, with "Multilingual" and "Code" receiving the highest weights (~15%).
* "Reweight Domains" and "Upweight Non Web w/ High Quality Web" show a more balanced distribution across data sources compared to the "Pretraining" approach.
* "Finance" consistently receives the lowest weight across all training approaches.
* "Misc." has a relatively high weight in "Reweight Domains", "Pretraining w/ High Quality Web", "No Web", and "Upweight Non Web w/ High Quality Web" approaches.
### Interpretation
The chart demonstrates how different training strategies prioritize various data sources. The dominance of "Web Crawl" in the "Pretraining" approach suggests that the model learns primarily from broad, general web data. The "No Web" approach, conversely, indicates a focus on curated, specialized datasets like "Multilingual" and "Code". The "Reweight Domains" and "Upweight Non Web w/ High Quality Web" strategies appear to aim for a more balanced and potentially refined learning process by adjusting the weights of different data sources. The low weighting of "Finance" across all approaches might indicate that this data source is considered less crucial for the model's overall performance or that it is already well-represented in other data sources. The differences in weighting highlight the trade-offs between breadth (web crawl) and depth (specialized datasets) in model training. The chart provides valuable insights into the data composition of different models and can inform decisions about data selection and weighting for future training runs.