## Grouped Bar Chart: Data Source Weight Distribution Across Training Strategies
### Overview
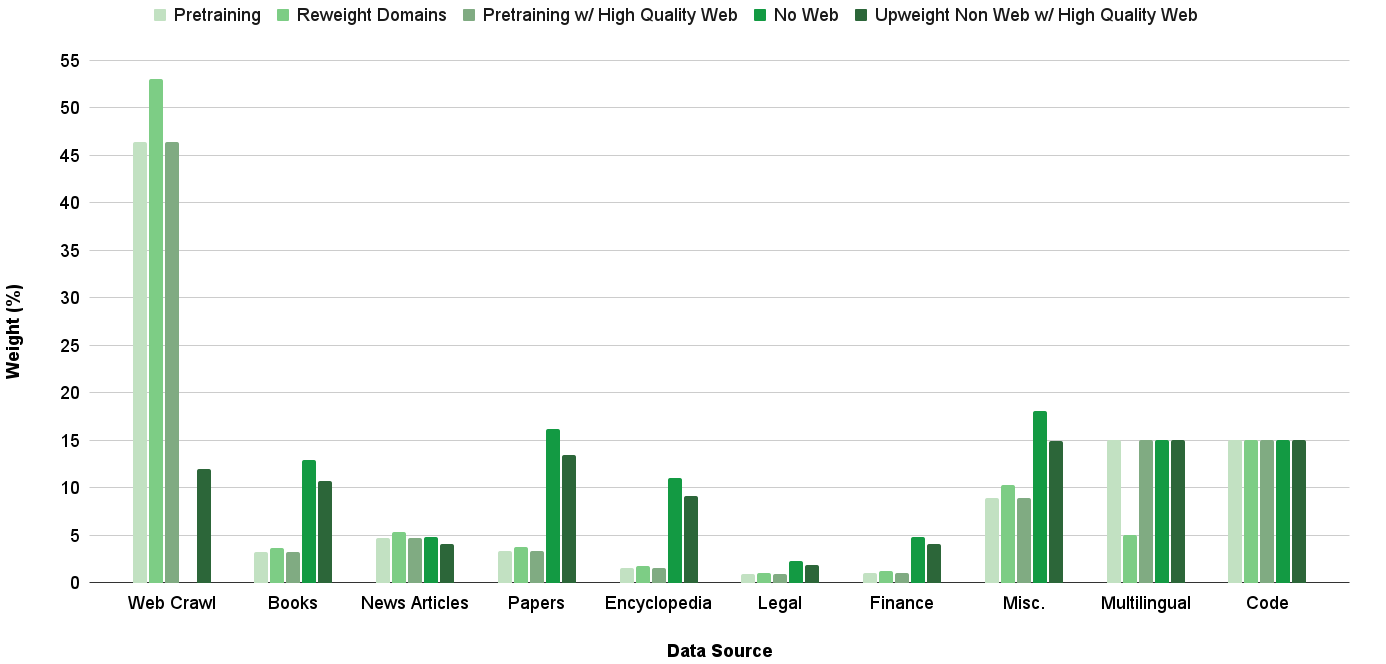
This image is a grouped bar chart illustrating the percentage weight assigned to ten different data sources under five distinct data curation or training strategies for a machine learning model. The chart compares how the importance (weight) of each data source changes depending on the methodology applied.
### Components/Axes
* **Chart Type:** Grouped Bar Chart.
* **X-Axis (Horizontal):** Labeled **"Data Source"**. It lists ten categorical data sources from left to right:
1. Web Crawl
2. Books
3. News Articles
4. Papers
5. Encyclopedia
6. Legal
7. Finance
8. Misc.
9. Multilingual
10. Code
* **Y-Axis (Vertical):** Labeled **"Weight (%)"**. It is a linear scale ranging from 0 to 55, with major gridlines at intervals of 5%.
* **Legend:** Positioned at the top of the chart, centered. It defines five data series (training strategies), each represented by a distinct shade of green:
1. **Pretraining** (Lightest green)
2. **Reweight Domains** (Light green)
3. **Pretraining w/ High Quality Web** (Medium green)
4. **No Web** (Dark green)
5. **Upweight Non Web w/ High Quality Web** (Darkest green)
### Detailed Analysis
The following table reconstructs the approximate weight (%) for each data source under each strategy. Values are estimated from the bar heights relative to the y-axis gridlines.
| Data Source | Pretraining | Reweight Domains | Pretraining w/ High Quality Web | No Web | Upweight Non Web w/ High Quality Web |
| :--- | :--- | :--- | :--- | :--- | :--- |
| **Web Crawl** | ~46% | ~53% | ~46% | ~12% | ~0% |
| **Books** | ~3% | ~4% | ~3% | ~13% | ~11% |
| **News Articles** | ~5% | ~5.5% | ~5% | ~5% | ~4% |
| **Papers** | ~3.5% | ~4% | ~3.5% | ~16% | ~13.5% |
| **Encyclopedia** | ~1.5% | ~2% | ~1.5% | ~11% | ~9% |
| **Legal** | ~1% | ~1% | ~1% | ~2.5% | ~2% |
| **Finance** | ~1% | ~1.5% | ~1% | ~5% | ~4% |
| **Misc.** | ~9% | ~10% | ~9% | ~18% | ~15% |
| **Multilingual** | ~15% | ~5% | ~15% | ~15% | ~15% |
| **Code** | ~15% | ~15% | ~15% | ~15% | ~15% |
**Trend Verification per Data Series:**
* **Pretraining & Pretraining w/ High Quality Web:** These two series have nearly identical profiles. They are heavily dominated by **Web Crawl** (~46%), with moderate contributions from **Multilingual** and **Code** (~15% each), and low single-digit percentages for most other sources.
* **Reweight Domains:** This strategy increases the weight of **Web Crawl** to its highest point (~53%) while drastically reducing the weight of **Multilingual** data (from ~15% to ~5%). Other sources see minor adjustments.
* **No Web:** This strategy shows a dramatic inversion. The weight of **Web Crawl** plummets to ~12%. The freed-up weight is redistributed primarily to **Misc.** (~18%), **Papers** (~16%), **Books** (~13%), and **Encyclopedia** (~11%). **Multilingual** and **Code** remain stable at ~15%.
* **Upweight Non Web w/ High Quality Web:** This strategy appears to completely eliminate **Web Crawl** (0%). It further boosts non-web sources compared to the "No Web" strategy, with the highest weights going to **Misc.** (~15%), **Papers** (~13.5%), and **Books** (~11%). **Multilingual** and **Code** remain constant at ~15%.
### Key Observations
1. **Web Crawl Dominance:** In three of the five strategies (Pretraining, Reweight Domains, Pretraining w/ HQ Web), Web Crawl is the overwhelmingly dominant data source, comprising nearly half or more of the total weight.
2. **Stability of Code & Multilingual:** The weight for **Code** is fixed at ~15% across all five strategies. **Multilingual** is stable at ~15% in four strategies, with a significant drop only in the "Reweight Domains" strategy.
3. **Redistribution Upon Web Removal:** The "No Web" and "Upweight Non Web" strategies demonstrate a clear redistribution pattern. Removing or down-weighting web crawl data leads to a substantial increase in the relative importance of curated, high-quality sources like **Papers**, **Books**, **Encyclopedias**, and the **Miscellaneous** category.
4. **"Misc." Category Significance:** The **Misc.** category becomes the largest or second-largest data source in the strategies that minimize web data, suggesting it contains a substantial volume of valuable non-web content.
### Interpretation
This chart visualizes the strategic trade-offs in data curation for training large language models. The data suggests:
* **The "Default" Reliance on Web Data:** Standard pretraining ("Pretraining") and even quality-filtered web data ("Pretraining w/ High Quality Web") rely heavily on web crawl data, indicating its perceived value in terms of volume and diversity for general language model training.
* **Intentional Domain Reweighting:** The "Reweight Domains" strategy appears to be an optimization that further amplifies web data at the expense of multilingual data, possibly to improve performance on web-centric tasks or English-language benchmarks.
* **The Non-Web Alternative Pathway:** The "No Web" and "Upweight Non Web" strategies represent a deliberate philosophical shift. They posit that high-quality, curated non-web sources (academic papers, books, encyclopedias) can effectively replace web data, potentially leading to models with stronger factual grounding, deeper reasoning, or reduced exposure to web noise and biases. The complete removal of web data in the final strategy is a strong statement about the viability of this alternative data mix.
* **Constant Pillars:** The fixed weight for **Code** across all strategies implies it is considered a non-negotiable, foundational data type for model capabilities, regardless of the overall data philosophy. The stability of **Multilingual** data (except in one targeted reweighting) suggests it is also a core component for maintaining broad language coverage.
In essence, the chart contrasts a **web-centric** training paradigm with a **curated non-web** paradigm, showing exactly how the data "diet" of a model is adjusted to pursue different performance and safety objectives.