## Bar Chart: Data Source Weight Distribution Across Categories
### Overview
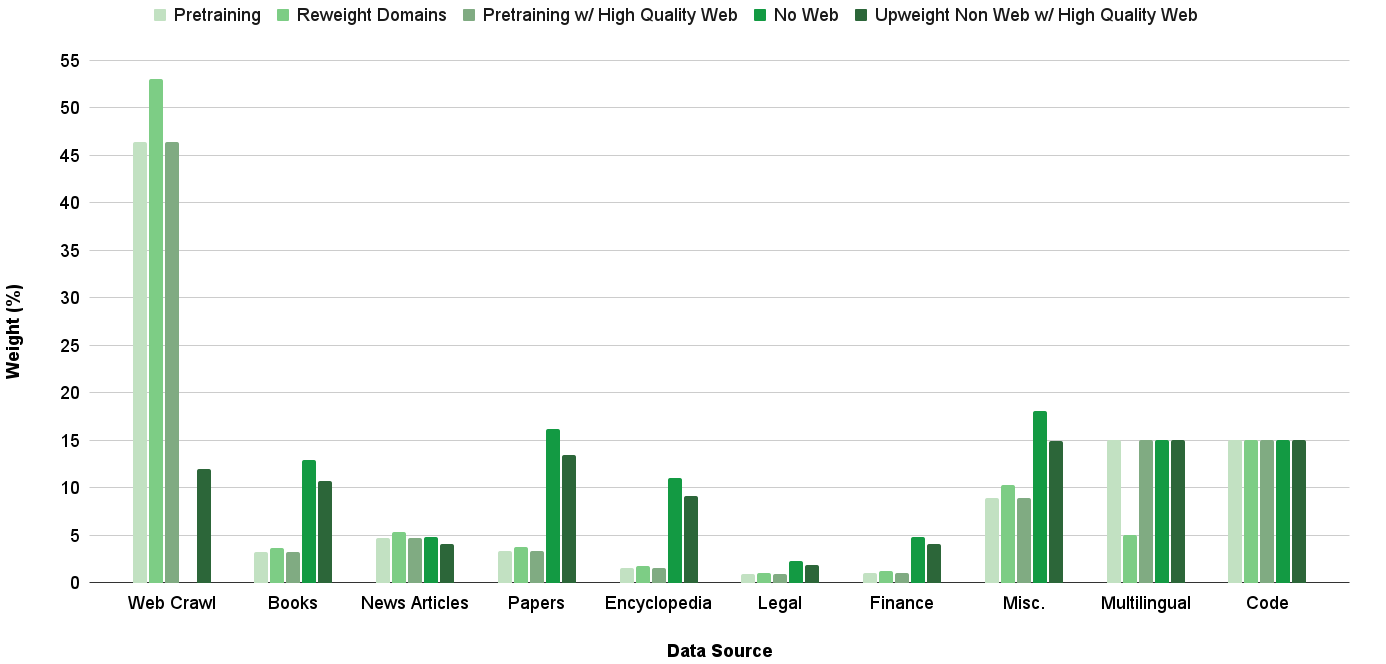
The chart compares the weight distribution (in percentage) of different data sources across five categories: Pretraining, Reweight Domains, Pretraining w/ High Quality Web, No Web, and Upweight Non Web w/ High Quality Web. The x-axis lists 10 data sources (Web Crawl, Books, News Articles, Papers, Encyclopedia, Legal, Finance, Misc., Multilingual, Code), while the y-axis ranges from 0% to 55%.
### Components/Axes
- **X-axis (Data Source)**: 10 categories (Web Crawl, Books, News Articles, Papers, Encyclopedia, Legal, Finance, Misc., Multilingual, Code).
- **Y-axis (Weight %)**: Scale from 0% to 55% in 5% increments.
- **Legend**: Located at the top, with five color-coded categories:
- Pretraining (light green)
- Reweight Domains (medium green)
- Pretraining w/ High Quality Web (gray)
- No Web (teal)
- Upweight Non Web w/ High Quality Web (dark green)
### Detailed Analysis
1. **Web Crawl**:
- Pretraining: ~46% (light green)
- Reweight Domains: ~53% (medium green)
- Pretraining w/ High Quality Web: ~46% (gray)
- No Web: 0%
- Upweight Non Web w/ High Quality Web: ~12% (dark green)
2. **Books**:
- Pretraining: ~3%
- Reweight Domains: ~4%
- Pretraining w/ High Quality Web: ~3%
- No Web: ~13%
- Upweight Non Web w/ High Quality Web: ~10%
3. **News Articles**:
- Pretraining: ~5%
- Reweight Domains: ~5%
- Pretraining w/ High Quality Web: ~4%
- No Web: ~5%
- Upweight Non Web w/ High Quality Web: ~4%
4. **Papers**:
- Pretraining: ~3%
- Reweight Domains: ~4%
- Pretraining w/ High Quality Web: ~3%
- No Web: ~16%
- Upweight Non Web w/ High Quality Web: ~13%
5. **Encyclopedia**:
- Pretraining: ~1%
- Reweight Domains: ~1%
- Pretraining w/ High Quality Web: ~1%
- No Web: ~11%
- Upweight Non Web w/ High Quality Web: ~9%
6. **Legal**:
- Pretraining: ~1%
- Reweight Domains: ~1%
- Pretraining w/ High Quality Web: ~1%
- No Web: ~2%
- Upweight Non Web w/ High Quality Web: ~2%
7. **Finance**:
- Pretraining: ~1%
- Reweight Domains: ~1%
- Pretraining w/ High Quality Web: ~1%
- No Web: ~5%
- Upweight Non Web w/ High Quality Web: ~4%
8. **Misc.**:
- Pretraining: ~9%
- Reweight Domains: ~10%
- Pretraining w/ High Quality Web: ~8%
- No Web: ~18%
- Upweight Non Web w/ High Quality Web: ~15%
9. **Multilingual**:
- Pretraining: 0%
- Reweight Domains: ~5%
- Pretraining w/ High Quality Web: 0%
- No Web: 0%
- Upweight Non Web w/ High Quality Web: ~15%
10. **Code**:
- Pretraining: ~15%
- Reweight Domains: ~15%
- Pretraining w/ High Quality Web: ~15%
- No Web: 0%
- Upweight Non Web w/ High Quality Web: ~15%
### Key Observations
- **Dominance of Web Crawl**: The Web Crawl data source has the highest weights in Pretraining (~46%) and Reweight Domains (~53%), with significant Pretraining w/ High Quality Web (~46%).
- **Upweight Consistency**: The "Upweight Non Web w/ High Quality Web" category shows relatively stable weights across most data sources (e.g., 10-15% for Books, Papers, Encyclopedia).
- **Low Representation in Legal/Finance**: Legal and Finance data sources have minimal weights (<2%) across all categories.
- **Misc. and Code**: Misc. and Code data sources show balanced weights in Pretraining, Reweight Domains, and Upweight categories (~8-15%).
- **No Web Variability**: The "No Web" category has notable weights in Books (~13%), Papers (~16%), and Misc. (~18%), but is absent in Web Crawl and Code.
### Interpretation
The chart reveals that **Web Crawl** is heavily prioritized for Pretraining and Reweight Domains, suggesting it is a primary data source for foundational model training. The "Upweight Non Web w/ High Quality Web" category demonstrates consistent usage across diverse data sources, indicating a strategy to enhance model quality by selectively emphasizing high-quality non-web data.
Notably, **Legal** and **Finance** data sources are underrepresented, which may reflect domain-specific challenges in sourcing high-quality data. The absence of "No Web" in Web Crawl and Code highlights their reliance on web-based data, whereas Misc. and Papers show strong "No Web" weights, possibly indicating curated or synthetic data usage.
The balanced weights in **Code** across Pretraining, Reweight Domains, and Upweight categories suggest a holistic approach to leveraging code data for model development. Overall, the chart underscores the importance of data source selection and weighting strategies in optimizing model performance.