\n
## Diagram: Vector Representation of Modes
### Overview
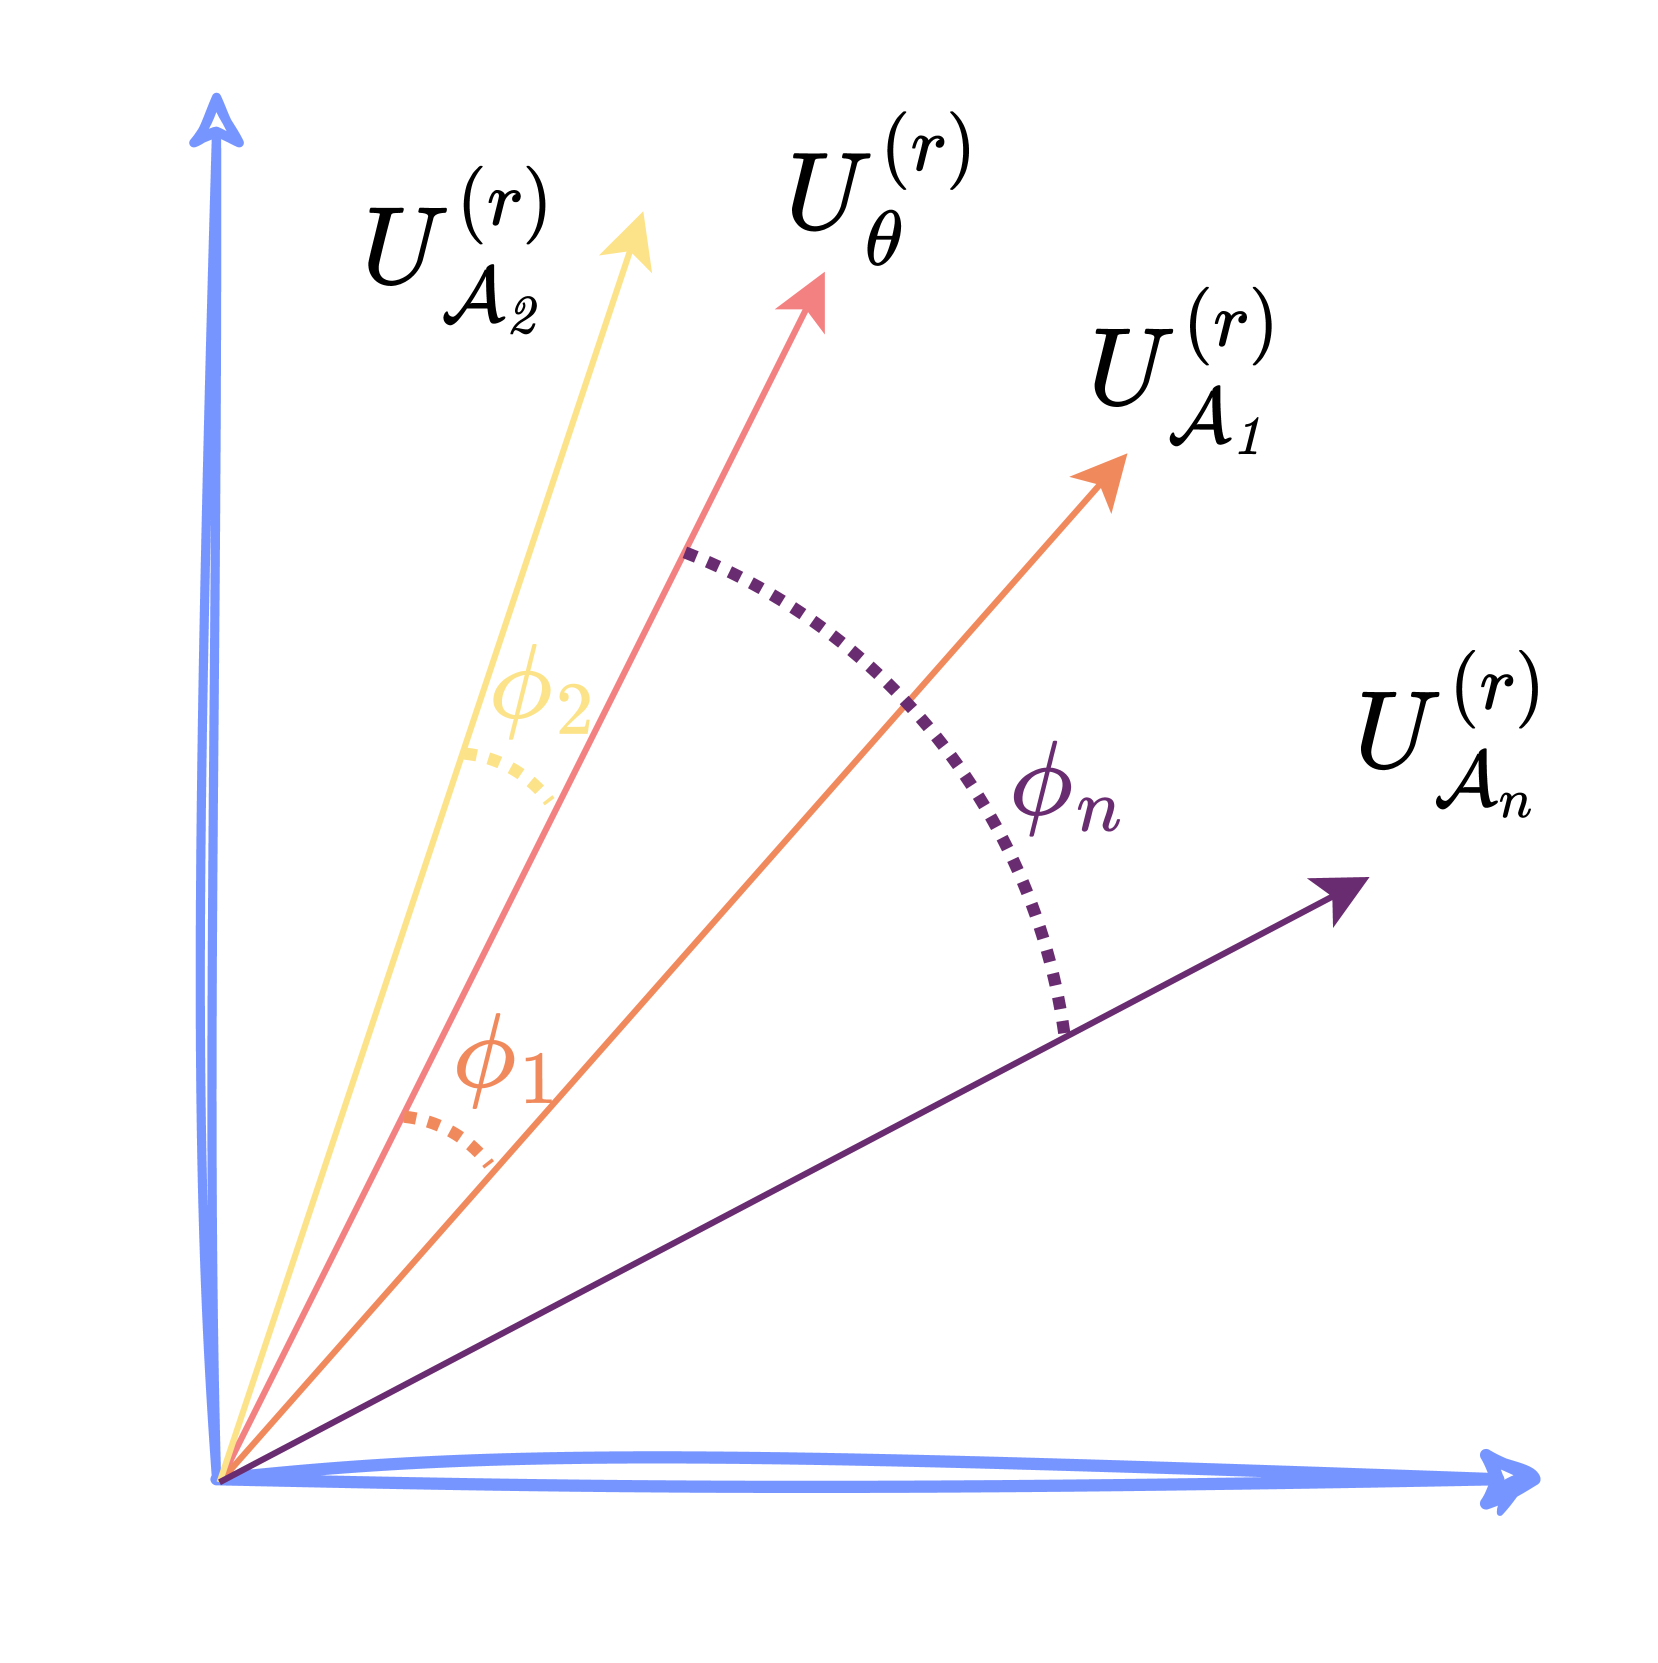
The image is a 3D vector diagram illustrating the representation of modes, denoted as U(r)A<sub>i</sub>, where 'i' ranges from 1 to n. The diagram depicts vectors originating from the origin and extending into three-dimensional space. Angles φ<sub>1</sub>, φ<sub>2</sub>, and φ<sub>n</sub> are indicated, representing the angular displacement of each vector from a common axis. A dashed arc connects the endpoints of the vectors, suggesting a relationship between them.
### Components/Axes
The diagram features three orthogonal axes, though they are not explicitly labeled with variables (e.g., x, y, z). The axes are colored as follows:
* **Blue:** Represents one axis.
* **Green:** Represents another axis.
* **Purple:** Represents the third axis.
The diagram includes the following labels:
* U<sup>(r)</sup><sub>A1</sub> (Green vector)
* U<sup>(r)</sup><sub>A2</sub> (Yellow vector)
* U<sup>(r)</sup><sub>θ</sub> (Purple vector)
* U<sup>(r)</sup><sub>An</sub> (Light Purple vector)
* φ<sub>1</sub> (Angle between the blue axis and U<sup>(r)</sup><sub>A1</sub>)
* φ<sub>2</sub> (Angle between the blue axis and U<sup>(r)</sup><sub>A2</sub>)
* φ<sub>n</sub> (Angle between the blue axis and U<sup>(r)</sup><sub>An</sub>)
### Detailed Analysis
The diagram shows 'n' vectors, each labeled as U<sup>(r)</sup><sub>Ai</sub>, where 'i' represents an index from 1 to 'n'. The superscript (r) likely indicates a radial component or dependence on a radius 'r'.
* **U<sup>(r)</sup><sub>A1</sub>:** A green vector, angled away from the blue axis by φ<sub>1</sub>.
* **U<sup>(r)</sup><sub>A2</sub>:** A yellow vector, angled away from the blue axis by φ<sub>2</sub>.
* **U<sup>(r)</sup><sub>θ</sub>:** A purple vector, aligned with the purple axis.
* **U<sup>(r)</sup><sub>An</sub>:** A light purple vector, angled away from the blue axis by φ<sub>n</sub>.
The angles φ<sub>1</sub>, φ<sub>2</sub>, and φ<sub>n</sub> are marked with dashed lines connecting the vectors to the blue axis. The dashed arc suggests a possible relationship or constraint between the vectors, potentially indicating they lie on a sphere or a similar curved surface. The vectors are not of equal length, suggesting varying magnitudes.
There is no numerical data provided in the image. The diagram is purely illustrative.
### Key Observations
* The vectors originate from a common point (the origin).
* The vectors are not co-linear, indicating they represent independent modes or components.
* The angles φ<sub>1</sub>, φ<sub>2</sub>, and φ<sub>n</sub> suggest a directional relationship between the vectors and the blue axis.
* The dashed arc implies a geometric constraint or relationship among the vectors.
* The vectors U<sup>(r)</sup><sub>A1</sub>, U<sup>(r)</sup><sub>A2</sub>, and U<sup>(r)</sup><sub>An</sub> are all in the same plane defined by the blue and green axes.
### Interpretation
This diagram likely represents a system with multiple modes of oscillation or vibration. The vectors U<sup>(r)</sup><sub>Ai</sub> could represent the amplitude and direction of each mode. The angles φ<sub>i</sub> define the orientation of each mode in space. The superscript (r) suggests that the modes are dependent on the radial distance 'r' from a central point.
The dashed arc could represent a constraint on the system, such as a fixed energy level or a boundary condition. The different lengths of the vectors indicate that the modes have different amplitudes, implying that they contribute differently to the overall behavior of the system.
The diagram is a visual representation of a mathematical model, likely used in physics or engineering to analyze the behavior of complex systems. Without further context, it is difficult to determine the specific application of this model. The diagram is a conceptual illustration rather than a presentation of specific data.