## Bar Chart: Average Number of Thinking Tokens vs. Question Difficulty
### Overview
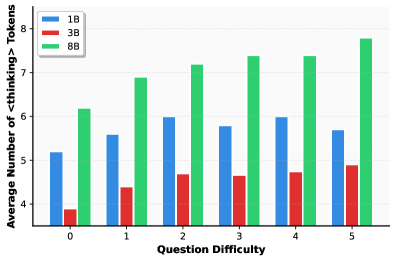
The image is a bar chart comparing the average number of "<thinking> Tokens" used by three different models (1B, 3B, and 8B) across varying levels of "Question Difficulty" (0 to 5). The chart visually represents how the number of tokens changes with increasing question difficulty for each model.
### Components/Axes
* **X-axis:** "Question Difficulty" with integer values from 0 to 5.
* **Y-axis:** "Average Number of <thinking> Tokens" ranging from 4 to 8.
* **Legend (Top-Left):**
* Blue: 1B
* Red: 3B
* Green: 8B
* **Gridlines:** Horizontal gridlines are present at integer values on the Y-axis.
### Detailed Analysis
The chart displays three sets of bars for each question difficulty level, corresponding to the 1B (blue), 3B (red), and 8B (green) models.
* **1B (Blue):**
* Difficulty 0: ~5.2
* Difficulty 1: ~5.6
* Difficulty 2: ~6.0
* Difficulty 3: ~5.7
* Difficulty 4: ~6.0
* Difficulty 5: ~5.7
* Trend: Relatively stable, with minor fluctuations.
* **3B (Red):**
* Difficulty 0: ~3.9
* Difficulty 1: ~4.4
* Difficulty 2: ~4.7
* Difficulty 3: ~4.7
* Difficulty 4: ~4.7
* Difficulty 5: ~4.9
* Trend: Slightly increasing, but mostly stable.
* **8B (Green):**
* Difficulty 0: ~6.2
* Difficulty 1: ~6.9
* Difficulty 2: ~7.2
* Difficulty 3: ~7.4
* Difficulty 4: ~7.4
* Difficulty 5: ~7.8
* Trend: Consistently increasing with question difficulty.
### Key Observations
* The 8B model consistently uses more "<thinking> Tokens" than the 1B and 3B models across all difficulty levels.
* The 3B model uses the fewest tokens.
* The number of tokens used by the 8B model increases more noticeably with question difficulty compared to the other two models.
### Interpretation
The data suggests that the 8B model engages in more "thinking" (as measured by the number of tokens) as the question difficulty increases. The 1B model shows a relatively stable level of "thinking" regardless of difficulty, while the 3B model remains the lowest and most stable. This could indicate that the 8B model is better equipped to handle complex questions, requiring more processing or a more detailed approach. The 3B model may be using a simpler, less token-intensive strategy, regardless of the question's complexity. The 1B model falls in between, showing some sensitivity to difficulty but not as pronounced as the 8B model.