\n
## Bar Chart: Average Number of <thinking> Tokens vs. Question Difficulty
### Overview
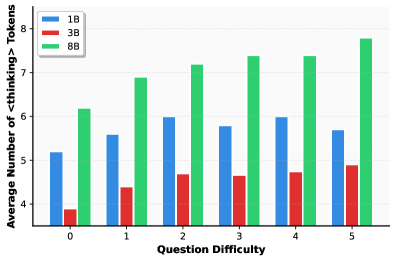
This image presents a bar chart comparing the average number of "<thinking>" tokens generated by three different models (1B, 3B, and 8B) across varying levels of question difficulty, ranging from 0 to 5. The chart uses grouped bar representations for each difficulty level, allowing for a direct comparison between the models.
### Components/Axes
* **X-axis:** "Question Difficulty" - Ranges from 0 to 5, with each integer representing a difficulty level.
* **Y-axis:** "Average Number of <thinking> Tokens" - Ranges from approximately 4.5 to 7.5.
* **Legend:** Located in the top-left corner, identifies the models:
* Blue: 1B
* Red: 3B
* Green: 8B
### Detailed Analysis
The chart consists of six groups of three bars, one for each model at each difficulty level.
* **Difficulty 0:**
* 1B: Approximately 5.2
* 3B: Approximately 2.3
* 8B: Approximately 6.3
* **Difficulty 1:**
* 1B: Approximately 5.8
* 3B: Approximately 3.2
* 8B: Approximately 7.0
* **Difficulty 2:**
* 1B: Approximately 6.0
* 3B: Approximately 4.3
* 8B: Approximately 7.2
* **Difficulty 3:**
* 1B: Approximately 5.5
* 3B: Approximately 4.4
* 8B: Approximately 7.4
* **Difficulty 4:**
* 1B: Approximately 6.0
* 3B: Approximately 4.5
* 8B: Approximately 7.4
* **Difficulty 5:**
* 1B: Approximately 5.7
* 3B: Approximately 4.7
* 8B: Approximately 8.4
**Trends:**
* **8B Model:** The 8B model consistently exhibits the highest average number of "<thinking>" tokens across all difficulty levels. The trend for the 8B model is generally upward, with a noticeable increase from difficulty 0 to 5.
* **1B Model:** The 1B model shows a relatively stable average number of tokens across the difficulty levels, fluctuating between approximately 5.5 and 6.0.
* **3B Model:** The 3B model consistently has the lowest average number of "<thinking>" tokens. It shows a slight upward trend as difficulty increases, but remains significantly lower than the 1B and 8B models.
### Key Observations
* The 8B model generates significantly more "<thinking>" tokens than the 1B and 3B models at all difficulty levels.
* The 3B model consistently generates the fewest "<thinking>" tokens.
* The difference in token generation between the models appears to increase with question difficulty.
* The 1B model shows a relatively consistent level of token generation regardless of question difficulty.
### Interpretation
The data suggests that larger language models (specifically, the 8B model in this case) engage in more extensive "thinking" – as measured by the generation of "<thinking>" tokens – when processing questions. This could indicate a greater capacity for complex reasoning or a more verbose internal representation of the problem-solving process. The 3B model's lower token count might suggest a more concise or less elaborate approach to problem-solving, or potentially a reduced ability to articulate its reasoning process. The relatively stable performance of the 1B model across difficulty levels could indicate a limited capacity to adapt its reasoning strategy based on the complexity of the question.
The increasing gap in token generation between the models as difficulty increases suggests that the benefits of larger model size become more pronounced when tackling more challenging problems. This could be due to the increased need for complex reasoning and knowledge retrieval in difficult scenarios, which larger models are better equipped to handle. The "<thinking>" tokens likely represent internal reasoning steps or intermediate thoughts generated during the question-answering process, providing a proxy for the model's cognitive effort.