# Technical Document Extraction: Bar Chart Analysis
## Image Description
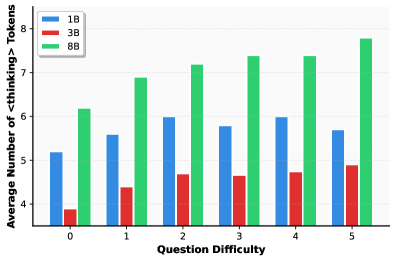
The image is a **bar chart** visualizing the relationship between **question difficulty** (x-axis) and the **average number of <thinking> tokens** (y-axis). Three data series are represented using distinct colors:
- **1B** (blue)
- **3B** (red)
- **8B** (green)
The chart includes a legend in the **top-left corner** and axis labels for both x and y axes.
---
## Key Components
### 1. **Legend**
- **Location**: Top-left corner
- **Labels**:
- Blue: `1B`
- Red: `3B`
- Green: `8B`
### 2. **Axes**
- **X-axis (Question Difficulty)**:
- Categories: `0, 1, 2, 3, 4, 5`
- Label: `Question Difficulty`
- **Y-axis (Average Number of <thinking> Tokens)**:
- Range: `3` to `8`
- Label: `Average Number of <thinking> Tokens`
---
## Data Series Analysis
### 1. **1B (Blue)**
- **Trend**:
- Starts at `5.2` (difficulty 0), increases to `5.7` (difficulty 2), then decreases to `5.6` (difficulty 5).
- **Values**:
- Difficulty 0: `5.2`
- Difficulty 1: `5.5`
- Difficulty 2: `5.9`
- Difficulty 3: `5.7`
- Difficulty 4: `5.9`
- Difficulty 5: `5.6`
### 2. **3B (Red)**
- **Trend**:
- Gradual increase from `3.8` (difficulty 0) to `4.9` (difficulty 5).
- **Values**:
- Difficulty 0: `3.8`
- Difficulty 1: `4.4`
- Difficulty 2: `4.6`
- Difficulty 3: `4.5`
- Difficulty 4: `4.7`
- Difficulty 5: `4.9`
### 3. **8B (Green)**
- **Trend**:
- Steady increase from `6.2` (difficulty 0) to `7.8` (difficulty 5).
- **Values**:
- Difficulty 0: `6.2`
- Difficulty 1: `6.8`
- Difficulty 2: `7.2`
- Difficulty 3: `7.4`
- Difficulty 4: `7.4`
- Difficulty 5: `7.8`
---
## Data Table Reconstruction
| Question Difficulty | 1B | 3B | 8B |
|---------------------|------|------|------|
| 0 | 5.2 | 3.8 | 6.2 |
| 1 | 5.5 | 4.4 | 6.8 |
| 2 | 5.9 | 4.6 | 7.2 |
| 3 | 5.7 | 4.5 | 7.4 |
| 4 | 5.9 | 4.7 | 7.4 |
| 5 | 5.6 | 4.9 | 7.8 |
---
## Observations
1. **1B (Blue)** shows a **non-linear trend**, peaking at difficulty 2 before declining slightly.
2. **3B (Red)** exhibits a **consistent upward trend** across all difficulty levels.
3. **8B (Green)** demonstrates the **strongest positive correlation** between question difficulty and token count, with a **steady increase** from 6.2 to 7.8.
---
## Notes
- The chart does not include a title or additional textual annotations beyond axis labels and legend.
- All data points align with the legend colors (blue = 1B, red = 3B, green = 8B).
- No other languages or textual elements are present in the image.