## Chart Type: Multiple Line Graphs
### Overview
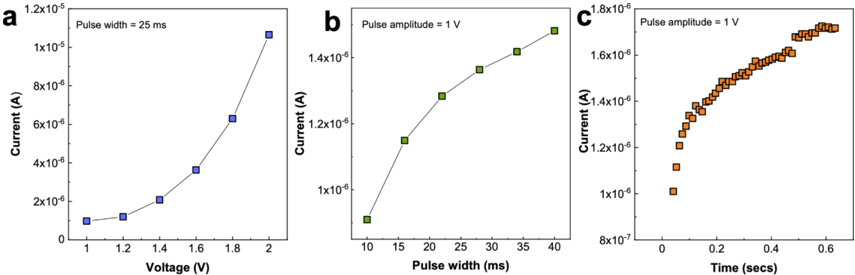
The image presents three line graphs (a, b, and c) showing the relationship between current (in Amperes) and different parameters: voltage (in Volts), pulse width (in milliseconds), and time (in seconds). Each graph has a specific condition mentioned in the title.
### Components/Axes
**Graph a:**
* **Title:** Pulse width = 25 ms
* **X-axis:** Voltage (V), with markers at 1, 1.2, 1.4, 1.6, 1.8, and 2.
* **Y-axis:** Current (A), with a scale from 0 to 1.2x10^-5. Markers are present at 2x10^-6, 4x10^-6, 6x10^-6, 8x10^-6, 1x10^-5, and 1.2x10^-5.
* **Data Series:** Blue squares connected by a line.
**Graph b:**
* **Title:** Pulse amplitude = 1 V
* **X-axis:** Pulse width (ms), with markers at 10, 15, 20, 25, 30, 35, and 40.
* **Y-axis:** Current (A), with a scale from 0 to 1.4x10^-6. Markers are present at 1x10^-6, 1.2x10^-6, and 1.4x10^-6.
* **Data Series:** Green squares connected by a line.
**Graph c:**
* **Title:** Pulse amplitude = 1 V
* **X-axis:** Time (secs), with markers at 0, 0.2, 0.4, and 0.6.
* **Y-axis:** Current (A), with a scale from approximately 8x10^-7 to 1.8x10^-6. Markers are present at 8x10^-7, 1x10^-6, 1.2x10^-6, 1.4x10^-6, 1.6x10^-6, and 1.8x10^-6.
* **Data Series:** Orange squares connected by a line.
### Detailed Analysis
**Graph a (Current vs. Voltage):**
* The current increases as the voltage increases.
* At 1 V, the current is approximately 1x10^-6 A.
* At 1.2 V, the current is approximately 1.2x10^-6 A.
* At 1.4 V, the current is approximately 2.1x10^-6 A.
* At 1.6 V, the current is approximately 3.7x10^-6 A.
* At 1.8 V, the current is approximately 6.3x10^-6 A.
* At 2 V, the current is approximately 1.1x10^-5 A.
**Graph b (Current vs. Pulse Width):**
* The current increases as the pulse width increases.
* At 10 ms, the current is approximately 8.8x10^-7 A.
* At 15 ms, the current is approximately 1.15x10^-6 A.
* At 20 ms, the current is approximately 1.25x10^-6 A.
* At 25 ms, the current is approximately 1.35x10^-6 A.
* At 30 ms, the current is approximately 1.42x10^-6 A.
* At 35 ms, the current is approximately 1.45x10^-6 A.
* At 40 ms, the current is approximately 1.5x10^-6 A.
**Graph c (Current vs. Time):**
* The current increases rapidly initially and then plateaus after approximately 0.4 seconds.
* At 0 seconds, the current is approximately 1.0x10^-6 A.
* At 0.1 seconds, the current is approximately 1.3x10^-6 A.
* At 0.2 seconds, the current is approximately 1.4x10^-6 A.
* At 0.3 seconds, the current is approximately 1.5x10^-6 A.
* At 0.4 seconds, the current is approximately 1.65x10^-6 A.
* From 0.5 to 0.6 seconds, the current remains relatively constant at approximately 1.7x10^-6 A.
### Key Observations
* In graph a, the relationship between current and voltage appears to be non-linear, with the current increasing more rapidly at higher voltages.
* In graph b, the current increases with pulse width, but the rate of increase slows down at higher pulse widths.
* In graph c, the current exhibits a transient behavior, increasing rapidly at first and then reaching a steady-state value.
### Interpretation
The graphs illustrate how current responds to changes in voltage, pulse width, and time under specific conditions. Graph a shows the current response to varying voltage with a fixed pulse width. Graph b shows the current response to varying pulse width with a fixed voltage amplitude. Graph c shows the current response over time with a fixed voltage amplitude. The data suggests that the current is influenced by all three parameters, with the voltage having a more pronounced effect than the pulse width. The transient behavior in graph c indicates a capacitive or inductive effect in the circuit. The plateauing of the current in graph c suggests a saturation effect or a limit to the current flow.