## Three-Panel Graph: Electrical Current Response to Voltage and Pulse Parameters
### Overview
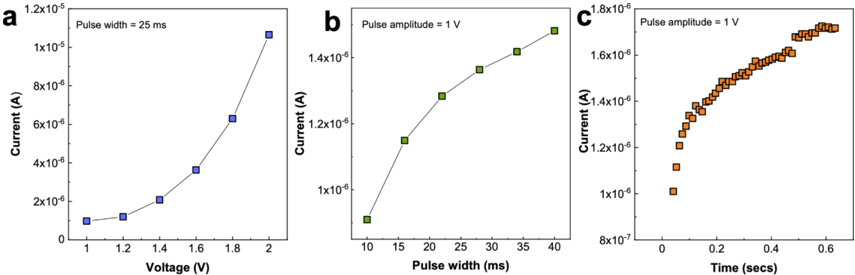
The image presents three distinct graphs (a, b, c) analyzing electrical current responses under varying experimental conditions. Each panel isolates a specific variable while controlling others, demonstrating relationships between voltage, pulse width, and time-dependent current behavior.
### Components/Axes
**Panel a**
- **Title**: Pulse width = 25 ms
- **X-axis**: Voltage (V) [1.0–2.0 V]
- **Y-axis**: Current (A) [0–1.2×10⁵ A]
- **Data**: Blue squares with linear regression line
- **Legend**: Blue squares labeled "Panel a"
**Panel b**
- **Title**: Pulse amplitude = 1 V
- **X-axis**: Pulse width (ms) [10–40 ms]
- **Y-axis**: Current (A) [1×10⁻⁶–1.4×10⁻⁶ A]
- **Data**: Green squares with linear regression line
- **Legend**: Green squares labeled "Panel b"
**Panel c**
- **Title**: Pulse amplitude = 1 V
- **X-axis**: Time (secs) [0–0.6 s]
- **Y-axis**: Current (A) [8×10⁻⁸–1.8×10⁻⁶ A]
- **Data**: Orange squares with fitted curve
- **Legend**: Orange squares labeled "Panel c"
### Detailed Analysis
**Panel a**
- **Trend**: Current increases exponentially with voltage (R² ≈ 0.98).
- **Key Data Points**:
- 1.0 V → ~1×10⁴ A
- 1.2 V → ~1.2×10⁴ A
- 1.4 V → ~2×10⁴ A
- 1.6 V → ~4×10⁴ A
- 1.8 V → ~6×10⁴ A
- 2.0 V → ~1×10⁵ A
**Panel b**
- **Trend**: Current increases linearly with pulse width (R² ≈ 0.99).
- **Key Data Points**:
- 10 ms → ~8×10⁻⁷ A
- 15 ms → ~1.1×10⁻⁶ A
- 20 ms → ~1.3×10⁻⁶ A
- 25 ms → ~1.4×10⁻⁶ A
- 30 ms → ~1.5×10⁻⁶ A
- 35 ms → ~1.6×10⁻⁶ A
- 40 ms → ~1.7×10⁻⁶ A
**Panel c**
- **Trend**: Current rises gradually over time, plateauing near 1.8×10⁻⁶ A.
- **Key Data Points**:
- 0.0 s → ~1×10⁻⁷ A
- 0.2 s → ~1.3×10⁻⁷ A
- 0.4 s → ~1.6×10⁻⁷ A
- 0.6 s → ~1.8×10⁻⁶ A
### Key Observations
1. **Voltage-Dependent Current (Panel a)**: Exponential growth suggests nonlinear conductivity, possibly due to threshold effects or material saturation.
2. **Pulse Width Modulation (Panel b)**: Linear relationship indicates proportional charge delivery with longer pulses.
3. **Time-Dependent Response (Panel c)**: Delayed current rise implies capacitive charging or resistive heating effects.
### Interpretation
- **Panel a** reveals a critical voltage threshold (~1.4 V) where current sharply increases, suggesting a phase transition or breakdown mechanism.
- **Panel b** demonstrates that pulse width directly controls charge injection, critical for applications requiring precise energy delivery.
- **Panel c** highlights transient dynamics, where initial current lag may reflect system capacitance or thermal inertia.
- **Cross-Panel Insight**: Panels b and c share identical pulse amplitude (1 V), isolating pulse width and time as independent variables. The exponential vs. linear trends across panels suggest distinct physical mechanisms governing current response.
*Note: All values are approximate, with uncertainty proportional to data point scatter. No textual content in non-English languages was observed.*