# Technical Data Extraction: Bias Detection Threshold Chart
## 1. Document Overview
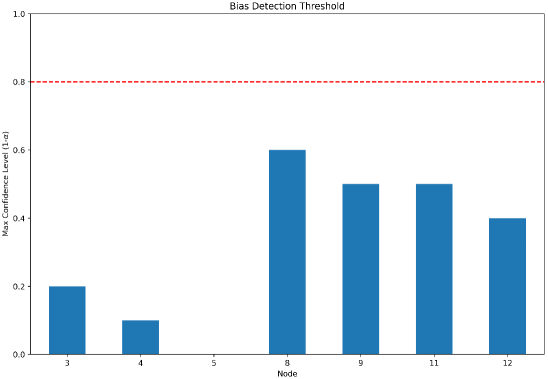
This image is a bar chart titled **"Bias Detection Threshold"**. It visualizes the confidence levels across various nodes relative to a predefined threshold.
## 2. Component Isolation
### Header
- **Title:** Bias Detection Threshold (Centered at top)
### Main Chart Area
- **Y-Axis Label:** Max Confidence Level (1-α)
- **X-Axis Label:** Node
- **Y-Axis Scale:** 0.0 to 1.0 (increments of 0.2)
- **X-Axis Categories:** 3, 4, 5, 8, 9, 11, 12
- **Threshold Line:** A horizontal dashed red line positioned at y = 0.8.
### Legend/Key
- There is no explicit text legend.
- **Visual Key:**
- **Blue Bars:** Represent the "Max Confidence Level" for each specific node.
- **Red Dashed Line:** Represents the "Bias Detection Threshold".
---
## 3. Data Extraction & Trend Verification
### Threshold Analysis
- **Value:** 0.8
- **Trend:** Constant across all nodes.
- **Observation:** All data points (bars) fall below this threshold, indicating that no node has reached the level required for bias detection according to this specific metric.
### Node Data Table
The following table reconstructs the values represented by the blue bars.
| Node (X-Axis) | Max Confidence Level (Y-Axis) | Status Relative to Threshold (0.8) |
| :--- | :--- | :--- |
| 3 | 0.2 | Below |
| 4 | 0.1 | Below |
| 5 | 0.0 | Below |
| 8 | 0.6 | Below |
| 9 | 0.5 | Below |
| 11 | 0.5 | Below |
| 12 | 0.4 | Below |
### Visual Trend Description
1. **Initial Low Phase:** Nodes 3 and 4 show very low confidence levels (0.2 and 0.1 respectively). Node 5 shows a null or zero value.
2. **Significant Increase:** There is a sharp upward trend moving from Node 5 to Node 8, where the confidence level peaks for this dataset at 0.6.
3. **Plateau and Slight Decline:** Following the peak at Node 8, the values stabilize at 0.5 for Nodes 9 and 11, before dipping slightly to 0.4 at Node 12.
4. **Overall Conclusion:** The data shows a "hump" distribution centered around Node 8, but remains consistently below the critical 0.8 threshold line.
---
## 4. Technical Summary
The chart evaluates seven specific nodes (3, 4, 5, 8, 9, 11, 12) against a **Bias Detection Threshold of 0.8**.
- **Maximum Value Recorded:** 0.6 (Node 8).
- **Minimum Value Recorded:** 0.0 (Node 5).
- **Compliance:** 100% of the nodes are below the bias detection threshold, as no blue bar intersects or exceeds the red dashed line.