# Technical Document Extraction: Bias Detection Threshold Chart
## Chart Overview
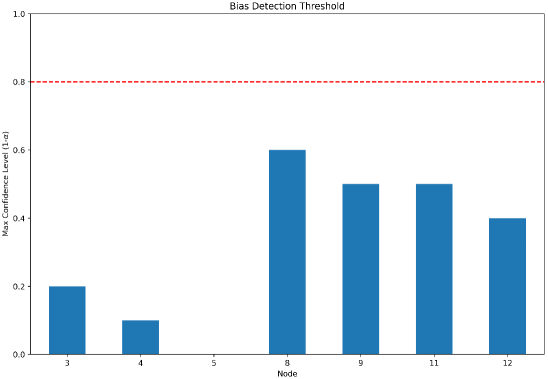
The image depicts a **bar chart** titled **"Bias Detection Threshold"**. The chart visualizes the relationship between **Node identifiers** (x-axis) and **Max Confidence Level (1-α)** (y-axis), with a horizontal reference line indicating a bias detection threshold.
---
### Axis Labels and Markers
- **X-Axis (Node):**
- Labels: `3`, `4`, `5`, `8`, `9`, `11`, `12`
- Spatial grounding: Nodes are evenly spaced along the x-axis.
- Note: Node `5` has no bar, indicating a value of `0`.
- **Y-Axis (Max Confidence Level (1-α)):**
- Range: `0.0` to `1.0`
- Tick marks: `0.0`, `0.2`, `0.4`, `0.6`, `0.8`, `1.0`
- Units: Dimensionless (confidence level).
- **Legend/Threshold Line:**
- A **red dashed horizontal line** at `y = 0.8` labeled **"Bias Detection Threshold"**.
- No explicit legend is present, but the red line serves as a reference for bias detection.
---
### Data Points and Trends
- **Bar Colors:** All bars are **blue**, consistent with the implied legend.
- **Key Observations:**
1. **Node 8** has the highest confidence level at **~0.6**.
2. **Nodes 9 and 11** share similar confidence levels at **~0.5**.
3. **Node 12** shows a confidence level of **~0.4**.
4. **Node 3** has a confidence level of **~0.2**.
5. **Node 4** has the lowest confidence level at **~0.1**.
6. **Node 5** has no bar, indicating a confidence level of `0.0`.
- **Trend Verification:**
- The confidence levels **increase non-linearly** from Node `3` to Node `8`, peaking at Node `8`.
- After Node `8`, confidence levels **decrease** for Nodes `9`, `11`, and `12`.
- Nodes `3`, `4`, and `5` show significantly lower confidence levels compared to the threshold.
---
### Component Isolation
1. **Header:**
- Title: `"Bias Detection Threshold"` (centered at the top).
2. **Main Chart:**
- Bar chart with nodes on the x-axis and confidence levels on the y-axis.
- Red dashed threshold line at `y = 0.8`.
3. **Footer:**
- No additional text or annotations.
---
### Critical Notes
- **Missing Elements:**
- No explicit legend for the blue bars, though their color is consistent.
- No numerical values explicitly labeled on the bars (e.g., `0.6` for Node `8`).
- **Assumptions:**
- The red dashed line at `0.8` represents a predefined bias detection threshold.
- Node identifiers (`3`, `4`, `5`, etc.) likely correspond to specific entities in a larger system (e.g., network nodes, data points).
---
### Final Output
The chart provides a visual summary of confidence levels for bias detection across seven nodes. Node `8` exceeds the threshold (`0.8`), while Nodes `3`, `4`, and `5` fall significantly below it. The absence of a bar for Node `5` suggests no detectable bias or a confidence level of `0.0`.