## Line Graphs: Validation Performance vs Training Samples
### Overview
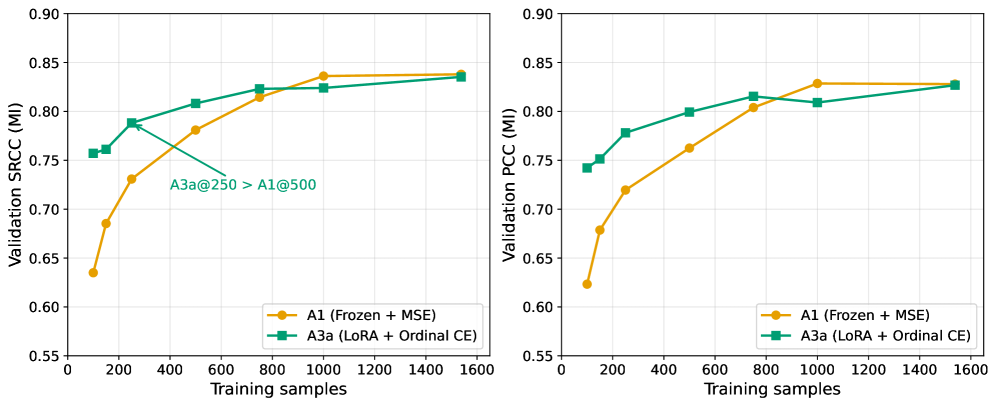
Two line graphs compare the validation performance of two models (A1 and A3a) across increasing training samples. The left graph measures **Validation SRCC (MI)**, while the right graph measures **Validation PCC (MI)**. Both graphs show performance trends for two configurations:
- **A1 (Frozen + MSE)** (orange line with circles)
- **A3a (LoRA + Ordinal CE)** (green line with squares)
A green arrow highlights a key comparison: **A3a@250 > A1@500**.
---
### Components/Axes
- **X-axis (both graphs)**: "Training samples" (0 to 1600 in increments of 200).
- **Y-axis (left graph)**: "Validation SRCC (MI)" (0.55 to 0.90).
- **Y-axis (right graph)**: "Validation PCC (MI)" (0.55 to 0.90).
- **Legends**:
- **A1 (Frozen + MSE)**: Orange line with circular markers.
- **A3a (LoRA + Ordinal CE)**: Green line with square markers.
- **Note**: Green arrow labeled "A3a@250 > A1@500" points to the left graph.
---
### Detailed Analysis
#### Left Graph (Validation SRCC)
- **A1 (Frozen + MSE)**:
- Starts at **0.64** (200 samples).
- Increases steadily to **0.84** (1600 samples).
- Slope: Gradual upward trend.
- **A3a (LoRA + Ordinal CE)**:
- Starts at **0.76** (200 samples).
- Peaks at **0.83** (250 samples).
- Slight dip to **0.84** (1600 samples).
- Slope: Sharp initial rise, then plateaus.
#### Right Graph (Validation PCC)
- **A1 (Frozen + MSE)**:
- Starts at **0.62** (200 samples).
- Rises to **0.83** (1600 samples).
- Slope: Steady upward trend.
- **A3a (LoRA + Ordinal CE)**:
- Starts at **0.74** (200 samples).
- Peaks at **0.82** (800 samples).
- Slight increase to **0.83** (1600 samples).
- Slope: Rapid initial growth, then stabilizes.
---
### Key Observations
1. **Performance Trends**:
- Both models improve with more training samples.
- **A3a** consistently outperforms **A1** in early stages (e.g., 200–500 samples).
- **A1** catches up to **A3a** by 1600 samples in both metrics.
2. **Notable Comparison**:
- The green arrow highlights that **A3a at 250 samples (0.83 SRCC)** exceeds **A1 at 500 samples (0.77 SRCC)**.
- Similar pattern in PCC: **A3a at 250 samples (0.77)** vs. **A1 at 500 samples (0.72)**.
3. **Model Efficiency**:
- **A3a (LoRA + Ordinal CE)** achieves higher performance with fewer samples, suggesting better parameter efficiency.
- **A1 (Frozen + MSE)** requires more data to match **A3a**'s early performance.
---
### Interpretation
The data demonstrates that **A3a (LoRA + Ordinal CE)** is more sample-efficient than **A1 (Frozen + MSE)**, particularly in early training stages. While **A1** eventually matches **A3a**'s performance with sufficient data, the former’s reliance on larger datasets may limit practicality in resource-constrained scenarios. The use of **LoRA** (Low-Rank Adaptation) and **Ordinal CE** (Cross-Entropy) in **A3a** likely contributes to its faster convergence, whereas **A1**’s **Frozen** weights and **MSE** loss function may require more samples to optimize effectively. This suggests that architectural choices (e.g., LoRA) and loss function design (Ordinal CE) significantly impact model efficiency and scalability.