## Line Chart: ΔP vs. Layer for Llama Models
### Overview
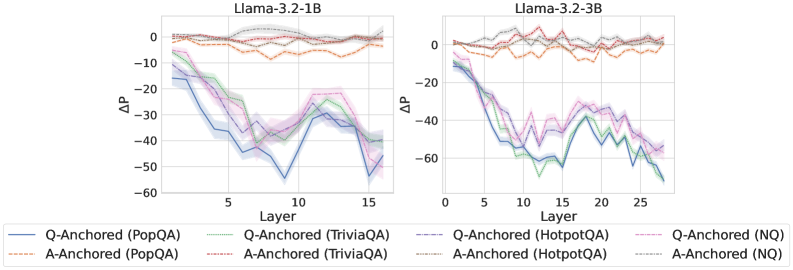
The image presents two line charts, side-by-side, comparing the change in probability (ΔP) across different layers of two Llama models: Llama-3.2-1B and Llama-3.2-3B. Each chart displays multiple lines representing different question-answering datasets and anchoring methods. The x-axis represents the layer number, and the y-axis represents ΔP.
### Components/Axes
* **X-axis:** Layer (ranging from approximately 0 to 15 for the 1B model and 0 to 25 for the 3B model).
* **Y-axis:** ΔP (ranging from approximately -60 to 0).
* **Left Chart Title:** Llama-3.2-1B
* **Right Chart Title:** Llama-3.2-3B
* **Legend (Bottom-Center):**
* Blue Line: Q-Anchored (PopQA)
* Orange Line: A-Anchored (PopQA)
* Purple Line: Q-Anchored (TriviaQA)
* Gray Line: A-Anchored (TriviaQA)
* Brown Dashed Line: Q-Anchored (HotpotQA)
* Red Dashed Line: A-Anchored (HotpotQA)
* Green Line: Q-Anchored (NQ)
* Teal Line: A-Anchored (NQ)
### Detailed Analysis or Content Details
**Llama-3.2-1B Chart (Left):**
* **Q-Anchored (PopQA) - Blue Line:** Starts at approximately ΔP = -2, decreases sharply to approximately ΔP = -45 around layer 7, then plateaus around ΔP = -40 to -45 until layer 15.
* **A-Anchored (PopQA) - Orange Line:** Starts at approximately ΔP = 0, decreases gradually to approximately ΔP = -15 around layer 10, then remains relatively stable around ΔP = -15 to -20 until layer 15.
* **Q-Anchored (TriviaQA) - Purple Line:** Starts at approximately ΔP = -5, decreases sharply to approximately ΔP = -40 around layer 7, then fluctuates between approximately ΔP = -35 and -45 until layer 15.
* **A-Anchored (TriviaQA) - Gray Line:** Starts at approximately ΔP = -2, decreases gradually to approximately ΔP = -20 around layer 10, then remains relatively stable around ΔP = -20 to -25 until layer 15.
* **Q-Anchored (HotpotQA) - Brown Dashed Line:** Starts at approximately ΔP = 0, decreases to approximately ΔP = -20 around layer 5, then fluctuates between approximately ΔP = -20 and -30 until layer 15.
* **A-Anchored (HotpotQA) - Red Dashed Line:** Starts at approximately ΔP = 0, decreases to approximately ΔP = -15 around layer 5, then fluctuates between approximately ΔP = -15 and -25 until layer 15.
* **Q-Anchored (NQ) - Green Line:** Starts at approximately ΔP = -3, decreases sharply to approximately ΔP = -40 around layer 7, then fluctuates between approximately ΔP = -35 and -45 until layer 15.
* **A-Anchored (NQ) - Teal Line:** Starts at approximately ΔP = -1, decreases gradually to approximately ΔP = -15 around layer 10, then remains relatively stable around ΔP = -15 to -20 until layer 15.
**Llama-3.2-3B Chart (Right):**
* **Q-Anchored (PopQA) - Blue Line:** Starts at approximately ΔP = -2, decreases sharply to approximately ΔP = -50 around layer 10, then fluctuates between approximately ΔP = -45 and -55 until layer 25.
* **A-Anchored (PopQA) - Orange Line:** Starts at approximately ΔP = 0, decreases gradually to approximately ΔP = -20 around layer 15, then remains relatively stable around ΔP = -20 to -30 until layer 25.
* **Q-Anchored (TriviaQA) - Purple Line:** Starts at approximately ΔP = -5, decreases sharply to approximately ΔP = -45 around layer 10, then fluctuates between approximately ΔP = -40 and -50 until layer 25.
* **A-Anchored (TriviaQA) - Gray Line:** Starts at approximately ΔP = -2, decreases gradually to approximately ΔP = -25 around layer 15, then remains relatively stable around ΔP = -25 to -35 until layer 25.
* **Q-Anchored (HotpotQA) - Brown Dashed Line:** Starts at approximately ΔP = 0, decreases to approximately ΔP = -25 around layer 10, then fluctuates between approximately ΔP = -25 and -35 until layer 25.
* **A-Anchored (HotpotQA) - Red Dashed Line:** Starts at approximately ΔP = 0, decreases to approximately ΔP = -20 around layer 10, then fluctuates between approximately ΔP = -20 and -30 until layer 25.
* **Q-Anchored (NQ) - Green Line:** Starts at approximately ΔP = -3, decreases sharply to approximately ΔP = -50 around layer 10, then fluctuates between approximately ΔP = -45 and -55 until layer 25.
* **A-Anchored (NQ) - Teal Line:** Starts at approximately ΔP = -1, decreases gradually to approximately ΔP = -20 around layer 15, then remains relatively stable around ΔP = -20 to -30 until layer 25.
### Key Observations
* In both charts, the Q-Anchored lines (blue, purple, brown, green) generally exhibit a steeper decrease in ΔP compared to the A-Anchored lines (orange, gray, red, teal).
* The 3B model (right chart) shows a more pronounced decrease in ΔP and extends to a greater number of layers compared to the 1B model (left chart).
* PopQA and NQ datasets consistently show the largest negative ΔP values, indicating the most significant change in probability.
* The HotpotQA dataset consistently shows the smallest negative ΔP values.
### Interpretation
The charts illustrate how the change in probability (ΔP) varies across layers for different question-answering datasets and anchoring methods in Llama models. The steeper decline in ΔP for Q-Anchored lines suggests that question-based anchoring leads to a more significant shift in the model's internal representations as it processes deeper layers. The larger negative ΔP values for PopQA and NQ datasets indicate that these datasets induce a greater change in the model's probability distribution. The 3B model's more pronounced decrease and extended layer range suggest that larger models exhibit more complex internal dynamics and potentially benefit more from deeper processing. The differences between A-Anchored and Q-Anchored lines suggest that the method of anchoring (question vs. answer) significantly impacts the model's learning process and internal representations. These findings could be used to optimize model architecture and training strategies for improved question-answering performance.