## Line Graph: ΔP Trends Across Layers for Llama-3.2-1B and Llama-3.2-3B Models
### Overview
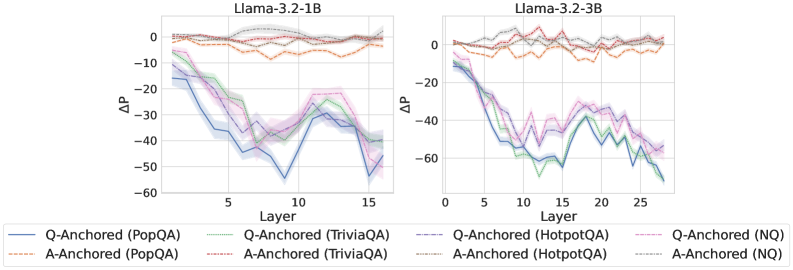
The image contains two side-by-side line graphs comparing ΔP (change in performance) across neural network layers for two versions of the Llama model (3.2-1B and 3.2-3B). Each graph tracks six distinct data series representing different anchoring methods (Q-Anchored vs. A-Anchored) and datasets (PopQA, TriviaQA, HotpotQA, NQ). The graphs show performance variability across layers, with shaded regions indicating uncertainty ranges.
### Components/Axes
- **Left Chart**: Llama-3.2-1B (15 layers)
- **Right Chart**: Llama-3.2-3B (25 layers)
- **Y-Axis**: ΔP (Performance Change) ranging from -60 to 0
- **X-Axis**: Layer number (0–15 for 1B, 0–25 for 3B)
- **Legend**: Located at the bottom, with six entries:
1. **Q-Anchored (PopQA)**: Solid blue line
2. **A-Anchored (PopQA)**: Dashed orange line
3. **Q-Anchored (TriviaQA)**: Dotted green line
4. **A-Anchored (TriviaQA)**: Dash-dot purple line
5. **Q-Anchored (HotpotQA)**: Solid purple line
6. **A-Anchored (NQ)**: Dashed gray line
### Detailed Analysis
#### Llama-3.2-1B (Left Chart)
- **Q-Anchored (PopQA)**: Starts at ~-10ΔP, dips to ~-50ΔP at layer 10, then rises to ~-30ΔP at layer 15.
- **A-Anchored (PopQA)**: Starts at ~-5ΔP, fluctuates between -10ΔP and -20ΔP, ending at ~-15ΔP.
- **Q-Anchored (TriviaQA)**: Begins at ~-20ΔP, peaks at ~-10ΔP at layer 5, then drops to ~-40ΔP.
- **A-Anchored (TriviaQA)**: Starts at ~-15ΔP, dips to ~-35ΔP at layer 10, then recovers to ~-25ΔP.
- **Q-Anchored (HotpotQA)**: Starts at ~-10ΔP, drops sharply to ~-50ΔP at layer 10, then rises to ~-30ΔP.
- **A-Anchored (NQ)**: Starts at ~-5ΔP, fluctuates between -10ΔP and -20ΔP, ending at ~-15ΔP.
#### Llama-3.2-3B (Right Chart)
- **Q-Anchored (PopQA)**: Starts at ~-10ΔP, dips to ~-50ΔP at layer 15, then rises to ~-30ΔP at layer 25.
- **A-Anchored (PopQA)**: Starts at ~-5ΔP, fluctuates between -10ΔP and -20ΔP, ending at ~-15ΔP.
- **Q-Anchored (TriviaQA)**: Begins at ~-20ΔP, peaks at ~-10ΔP at layer 10, then drops to ~-40ΔP.
- **A-Anchored (TriviaQA)**: Starts at ~-15ΔP, dips to ~-35ΔP at layer 20, then recovers to ~-25ΔP.
- **Q-Anchored (HotpotQA)**: Starts at ~-10ΔP, drops sharply to ~-60ΔP at layer 20, then rises to ~-40ΔP.
- **A-Anchored (NQ)**: Starts at ~-5ΔP, fluctuates between -10ΔP and -20ΔP, ending at ~-15ΔP.
### Key Observations
1. **Layer-Specific Trends**:
- ΔP generally decreases (worsens) as layers increase, with sharper declines in middle layers (e.g., layer 10–15 for 1B, layer 20 for 3B).
- Q-Anchored methods show more pronounced dips than A-Anchored methods in most cases.
2. **Dataset Variability**:
- HotpotQA (Q-Anchored) exhibits the most extreme ΔP drops (~-60ΔP in 3B model).
- NQ (A-Anchored) shows the least variability, maintaining ΔP between -10ΔP and -20ΔP.
3. **Uncertainty Patterns**:
- Shaded regions (likely confidence intervals) widen in middle layers, indicating higher variability in performance changes.
4. **Model Size Differences**:
- The 3B model (right chart) shows extended trends but similar patterns to the 1B model, with more pronounced fluctuations in later layers.
### Interpretation
The data suggests that anchoring methods (Q vs. A) and datasets significantly influence ΔP across layers. Q-Anchored methods generally underperform (lower ΔP) compared to A-Anchored methods, particularly in middle layers. The HotpotQA dataset amplifies performance drops, while NQ maintains stability. The 3B model’s extended layers reveal sustained trends but increased variability, implying that larger models may require more robust anchoring strategies to mitigate layer-specific performance degradation. The shaded regions highlight the need for further investigation into the sources of uncertainty, potentially linked to dataset complexity or model architecture differences.