# Technical Data Extraction: Performance Comparison of Base vs. Plugin Models
This document provides a comprehensive extraction of data from a series of bar charts comparing the performance of a "Base" model against a "Plugin" model across three datasets (Web NLG, CommonGen, and Adidas) using two metrics (BLEU and Rouge-L).
## 1. Metadata and Global Legend
* **Image Type:** Grouped Bar Charts (3x2 grid).
* **Legend Location:** Top-left chart (Row 1, Column 1).
* **Legend Categories:**
* **Base:** Light pink/mauve color.
* **Plugin:** Dark purple/plum color.
* **X-Axis Categories (Common to all charts):**
1. GPT2-M (zeroshot)
2. GPT2-M (1FT)
3. GPT2-M (2FT)
4. GPT2-M (5FT)
*Note: "FT" likely refers to Fine-Tuning epochs or stages.*
---
## 2. Data Extraction by Dataset
### (a) Web NLG Dataset
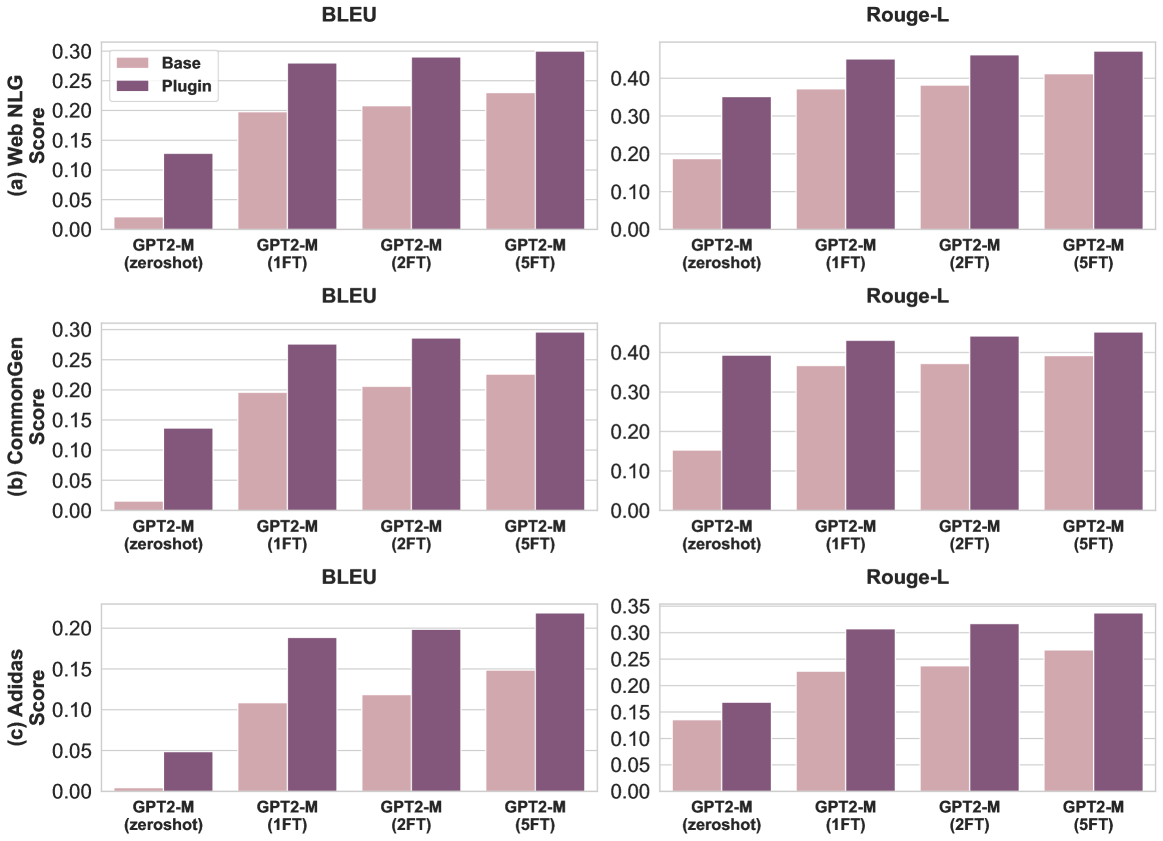
**Trend Analysis:** Both Base and Plugin scores increase as fine-tuning progresses from zeroshot to 5FT. The "Plugin" consistently and significantly outperforms the "Base" model, with the largest relative gap occurring at the "zeroshot" stage.
#### BLEU Score (Top Left)
* **Y-Axis Range:** 0.00 to 0.30 (increments of 0.05).
* **Data Points (Approximate):**
| Category | Base | Plugin |
| :--- | :--- | :--- |
| zeroshot | 0.02 | 0.13 |
| 1FT | 0.20 | 0.28 |
| 2FT | 0.21 | 0.29 |
| 5FT | 0.23 | 0.30 |
#### Rouge-L Score (Top Right)
* **Y-Axis Range:** 0.00 to 0.40+ (increments of 0.10).
* **Data Points (Approximate):**
| Category | Base | Plugin |
| :--- | :--- | :--- |
| zeroshot | 0.19 | 0.35 |
| 1FT | 0.37 | 0.45 |
| 2FT | 0.38 | 0.46 |
| 5FT | 0.41 | 0.47 |
---
### (b) CommonGen Dataset
**Trend Analysis:** Similar to Web NLG, there is a steady upward trend for both models. The Plugin model maintains a lead of approximately 0.05 to 0.10 points across all categories.
#### BLEU Score (Middle Left)
* **Y-Axis Range:** 0.00 to 0.30 (increments of 0.05).
* **Data Points (Approximate):**
| Category | Base | Plugin |
| :--- | :--- | :--- |
| zeroshot | 0.01 | 0.14 |
| 1FT | 0.20 | 0.28 |
| 2FT | 0.21 | 0.29 |
| 5FT | 0.23 | 0.30 |
#### Rouge-L Score (Middle Right)
* **Y-Axis Range:** 0.00 to 0.40+ (increments of 0.10).
* **Data Points (Approximate):**
| Category | Base | Plugin |
| :--- | :--- | :--- |
| zeroshot | 0.15 | 0.39 |
| 1FT | 0.37 | 0.43 |
| 2FT | 0.37 | 0.44 |
| 5FT | 0.39 | 0.45 |
---
### (c) Adidas Dataset
**Trend Analysis:** This dataset shows the lowest overall scores among the three. While the upward trend persists, the "Base" model starts near zero in the zeroshot BLEU category. The Plugin model provides a substantial performance boost, nearly doubling the Base score in several instances.
#### BLEU Score (Bottom Left)
* **Y-Axis Range:** 0.00 to 0.20+ (increments of 0.05).
* **Data Points (Approximate):**
| Category | Base | Plugin |
| :--- | :--- | :--- |
| zeroshot | 0.005 | 0.05 |
| 1FT | 0.11 | 0.19 |
| 2FT | 0.12 | 0.20 |
| 5FT | 0.15 | 0.22 |
#### Rouge-L Score (Bottom Right)
* **Y-Axis Range:** 0.00 to 0.35 (increments of 0.05).
* **Data Points (Approximate):**
| Category | Base | Plugin |
| :--- | :--- | :--- |
| zeroshot | 0.14 | 0.17 |
| 1FT | 0.23 | 0.31 |
| 2FT | 0.24 | 0.32 |
| 5FT | 0.27 | 0.34 |
---
## 3. Summary of Findings
1. **Plugin Efficacy:** In every single test case (3 datasets x 2 metrics x 4 training stages), the **Plugin** model (dark purple) outperforms the **Base** model (light pink).
2. **Zero-shot Impact:** The Plugin architecture provides a critical performance floor; where the Base model often fails or performs poorly in zero-shot scenarios, the Plugin model maintains usable scores.
3. **Scaling with Fine-Tuning:** While fine-tuning improves both models, the performance gap remains relatively consistent, suggesting the Plugin provides architectural advantages that are not entirely superseded by additional training data.