# Technical Document Extraction: Token Usage Comparison Chart
## 1. Document Overview
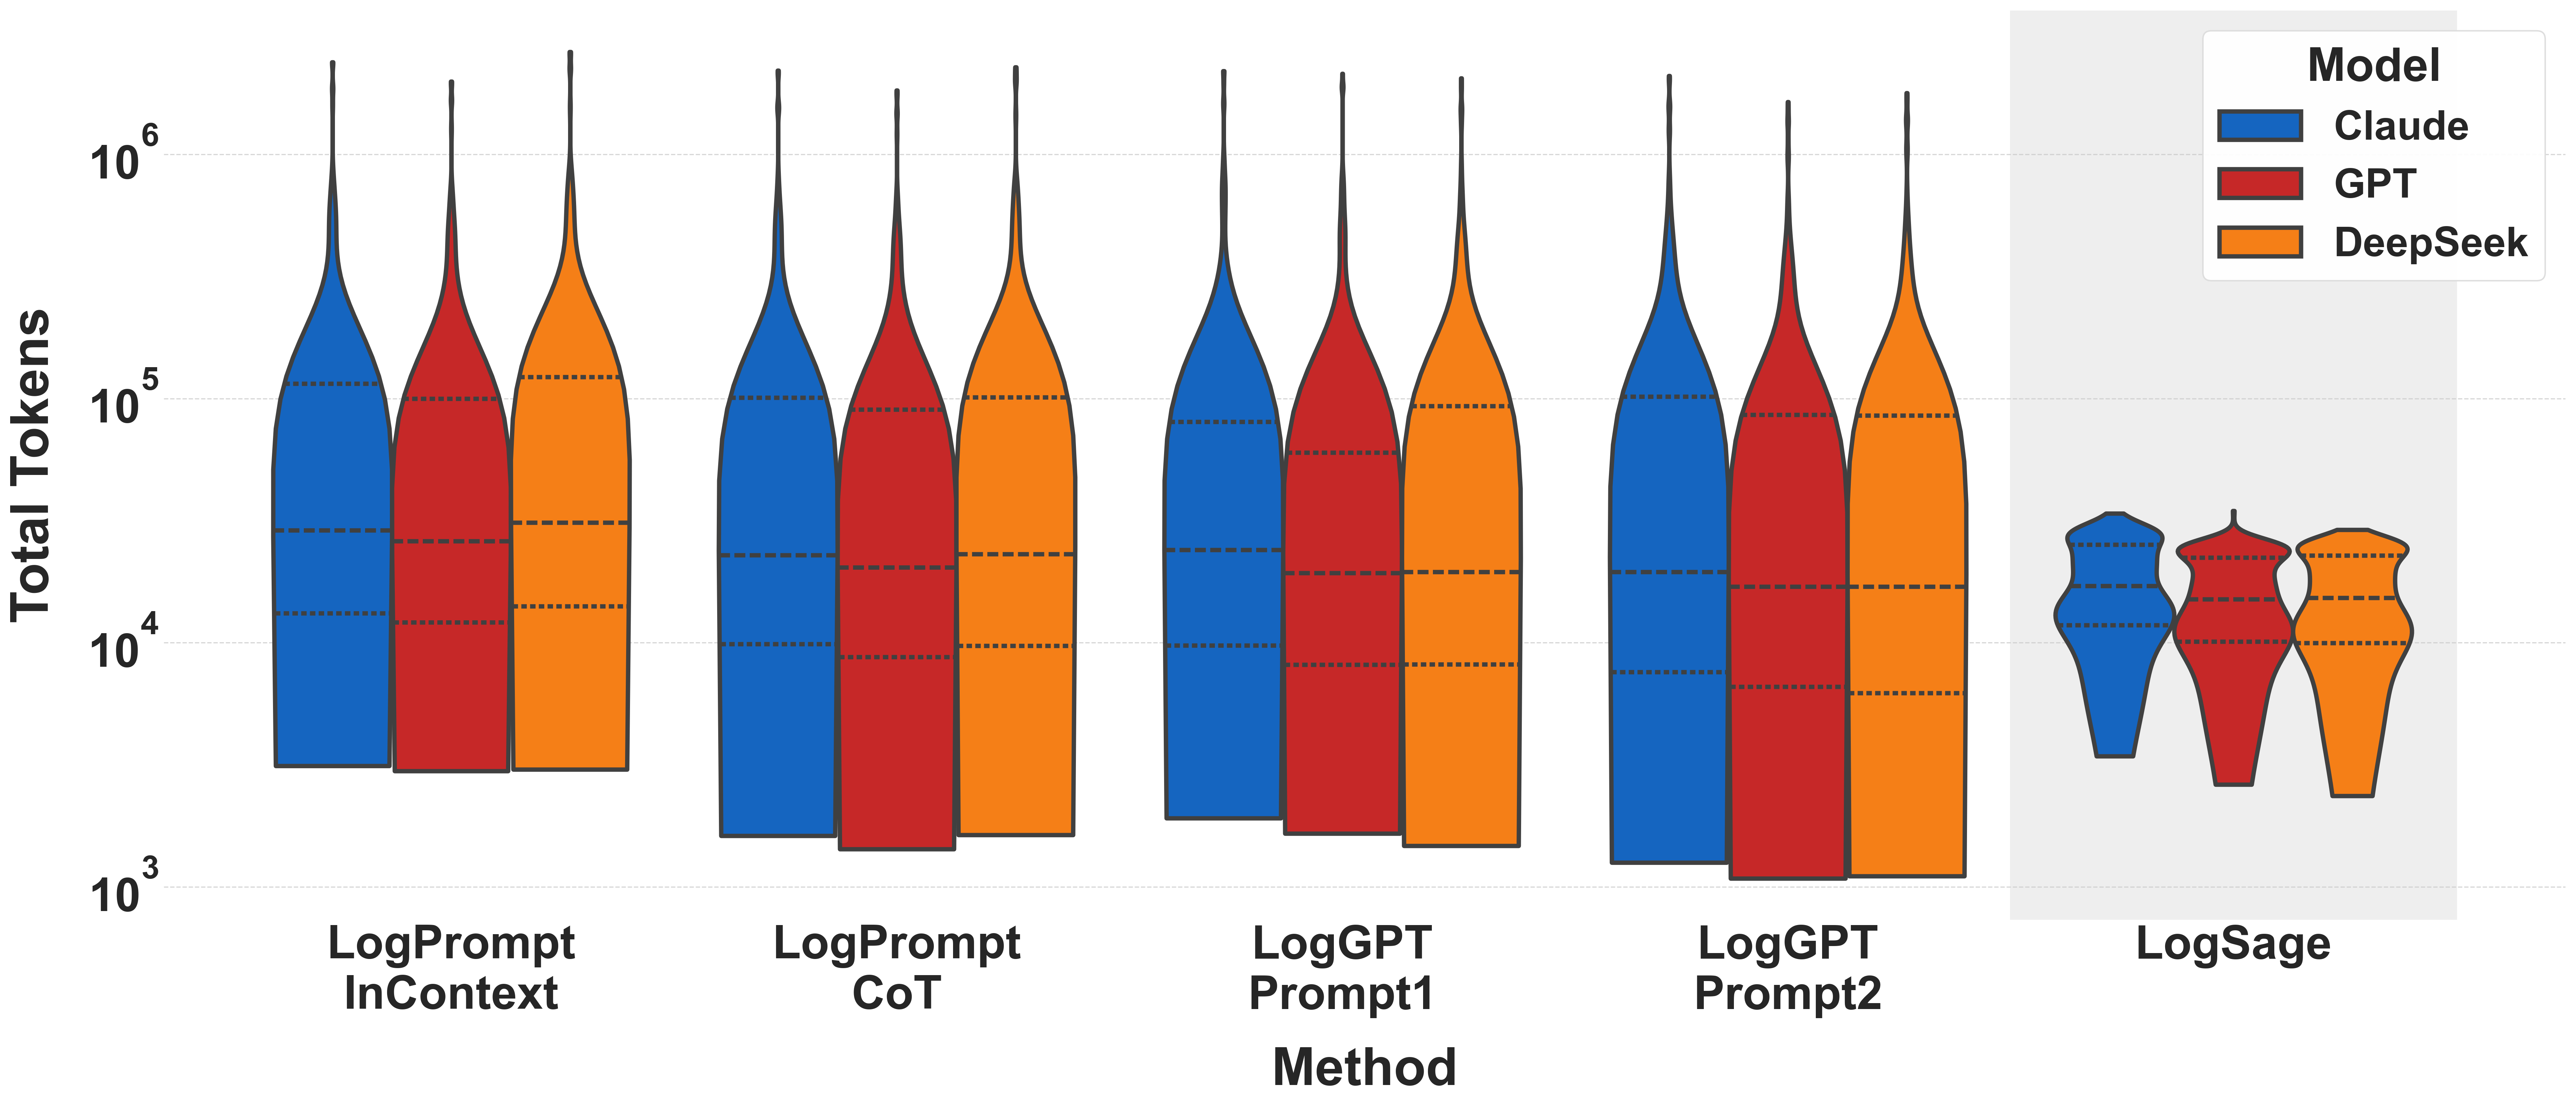
This image is a technical violin plot comparing the distribution of **Total Tokens** used by three different Large Language Model (LLM) families across five distinct prompting or architectural methods.
## 2. Component Isolation
### A. Header / Legend
* **Location:** Top right corner [approx. x=0.85, y=0.1].
* **Title:** `Model`
* **Categories (Color Coded):**
* **Blue:** `Claude`
* **Red:** `GPT`
* **Orange:** `DeepSeek`
### B. Axis Definitions
* **Y-Axis (Vertical):**
* **Label:** `Total Tokens`
* **Scale:** Logarithmic (Base 10).
* **Markers:** $10^3$, $10^4$, $10^5$, $10^6$.
* **Gridlines:** Horizontal dashed lines at each power of 10 and intermediate intervals.
* **X-Axis (Horizontal):**
* **Label:** `Method`
* **Categories:**
1. `LogPrompt InContext`
2. `LogPrompt CoT`
3. `LogGPT Prompt1`
4. `LogGPT Prompt2`
5. `LogSage` (Highlighted with a light gray background box).
## 3. Data Extraction and Trend Analysis
The chart uses violin plots to show density. Each violin contains three internal dashed horizontal lines representing the quartiles (25th, 50th/median, and 75th percentiles).
### Trend Verification
* **Methods 1-4:** Show high variance and high token consumption, with "tails" extending toward $10^6$ tokens.
* **Method 5 (LogSage):** Shows a significant reduction in token usage, with the entire distribution compressed between $10^3$ and $10^5$, and a much lower median compared to other methods.
### Detailed Data Points (Approximate Log Scale Values)
| Method | Model | Median (Middle Dash) | Interquartile Range (Approx) | Peak/Tail |
| :--- | :--- | :--- | :--- | :--- |
| **LogPrompt InContext** | Claude | ~$3 \times 10^4$ | $1.5 \times 10^4$ to $1 \times 10^5$ | ~$2 \times 10^6$ |
| | GPT | ~$2.5 \times 10^4$ | $1.2 \times 10^4$ to $1 \times 10^5$ | ~$2 \times 10^6$ |
| | DeepSeek | ~$3 \times 10^4$ | $1.5 \times 10^4$ to $1.2 \times 10^5$ | ~$3 \times 10^6$ |
| **LogPrompt CoT** | Claude | ~$2.5 \times 10^4$ | $1 \times 10^4$ to $1 \times 10^5$ | ~$2 \times 10^6$ |
| | GPT | ~$2 \times 10^4$ | $9 \times 10^3$ to $9 \times 10^4$ | ~$2 \times 10^6$ |
| | DeepSeek | ~$2.5 \times 10^4$ | $1 \times 10^4$ to $1 \times 10^5$ | ~$2 \times 10^6$ |
| **LogGPT Prompt1** | Claude | ~$2.5 \times 10^4$ | $1 \times 10^4$ to $8 \times 10^4$ | ~$2 \times 10^6$ |
| | GPT | ~$2 \times 10^4$ | $9 \times 10^3$ to $6 \times 10^4$ | ~$2 \times 10^6$ |
| | DeepSeek | ~$2 \times 10^4$ | $8 \times 10^3$ to $9 \times 10^4$ | ~$2 \times 10^6$ |
| **LogGPT Prompt2** | Claude | ~$2 \times 10^4$ | $8 \times 10^3$ to $1 \times 10^5$ | ~$2 \times 10^6$ |
| | GPT | ~$1.8 \times 10^4$ | $8 \times 10^3$ to $9 \times 10^4$ | ~$1.5 \times 10^6$ |
| | DeepSeek | ~$1.8 \times 10^4$ | $6 \times 10^3$ to $9 \times 10^4$ | ~$1.5 \times 10^6$ |
| **LogSage** | Claude | ~$1.2 \times 10^4$ | $8 \times 10^3$ to $2.5 \times 10^4$ | ~$3.5 \times 10^4$ |
| | GPT | ~$1 \times 10^4$ | $6 \times 10^3$ to $2 \times 10^4$ | ~$3.5 \times 10^4$ |
| | DeepSeek | ~$1.5 \times 10^4$ | $1 \times 10^4$ to $2.5 \times 10^4$ | ~$3.5 \times 10^4$ |
## 4. Key Observations
1. **Efficiency:** `LogSage` is the most token-efficient method across all models, significantly reducing the maximum token count (the "tail") by nearly two orders of magnitude compared to `LogPrompt` and `LogGPT` methods.
2. **Model Consistency:** Across all methods, `Claude`, `GPT`, and `DeepSeek` perform similarly, though `GPT` (Red) consistently trends slightly lower in median token usage than the others.
3. **Distribution Shape:** The first four methods show a "long-neck" distribution, indicating that while the median is around $2 \times 10^4$, there are frequent outliers requiring over $1,000,000$ tokens. `LogSage` eliminates these extreme outliers, resulting in a "bulbous" distribution that terminates well before $10^5$ tokens.