## Chart: SmolLM2-1.7B Proportion of Flips vs. Iterations
### Overview
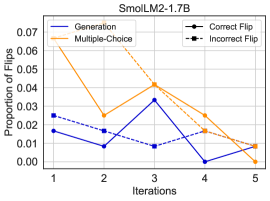
The image is a line chart comparing the proportion of flips across iterations for different methods (Generation, Multiple-Choice) and flip types (Correct Flip, Incorrect Flip) for SmolLM2-1.7B. The x-axis represents iterations (1 to 5), and the y-axis represents the proportion of flips (0.00 to 0.07).
### Components/Axes
* **Title:** SmolLM2-1.7B
* **X-axis:** Iterations (labeled 1, 2, 3, 4, 5)
* **Y-axis:** Proportion of Flips (labeled 0.00, 0.01, 0.02, 0.03, 0.04, 0.05, 0.06, 0.07)
* **Legend:** Located at the top-right of the chart.
* Generation (solid blue line)
* Multiple-Choice (solid orange line)
* Correct Flip (dashed black line with circular markers)
* Incorrect Flip (dashed black line with square markers)
### Detailed Analysis
* **Generation (Solid Blue Line):**
* Trend: Initially decreases, then increases, then decreases again.
* Data Points:
* Iteration 1: ~0.017
* Iteration 2: ~0.008
* Iteration 3: ~0.033
* Iteration 4: ~0.000
* Iteration 5: ~0.008
* **Multiple-Choice (Solid Orange Line):**
* Trend: Decreases, then increases, then decreases.
* Data Points:
* Iteration 1: ~0.065
* Iteration 2: ~0.025
* Iteration 3: ~0.042
* Iteration 4: ~0.025
* Iteration 5: ~0.008
* **Correct Flip (Dashed Black Line with Circular Markers):**
* Trend: Decreases slightly, then remains relatively stable.
* Data Points:
* Iteration 1: ~0.017
* Iteration 2: ~0.015
* Iteration 3: ~0.008
* Iteration 4: ~0.015
* Iteration 5: ~0.008
* **Incorrect Flip (Dashed Black Line with Square Markers):**
* Trend: Decreases, then increases, then decreases.
* Data Points:
* Iteration 1: ~0.025
* Iteration 2: ~0.016
* Iteration 3: ~0.008
* Iteration 4: ~0.016
* Iteration 5: ~0.008
### Key Observations
* The "Multiple-Choice" method starts with a higher proportion of flips but decreases significantly over iterations.
* The "Generation" method shows more fluctuation in the proportion of flips.
* The "Correct Flip" proportion remains relatively stable across iterations.
* The "Incorrect Flip" proportion decreases and then increases slightly.
### Interpretation
The chart illustrates how the proportion of flips changes across iterations for different methods and flip types in SmolLM2-1.7B. The "Multiple-Choice" method initially has a higher proportion of flips, suggesting it might be more prone to errors early on, but it improves significantly with more iterations. The "Generation" method's fluctuations indicate a less consistent performance. The relatively stable "Correct Flip" proportion suggests a consistent level of correct adjustments. The "Incorrect Flip" proportion shows a decrease, indicating an improvement in reducing incorrect adjustments over iterations. The data suggests that the model's performance varies depending on the method used and the type of flip being made.