\n
## Line Chart: Proportion of Flips vs. Iterations for SmolLM2-1.7B
### Overview
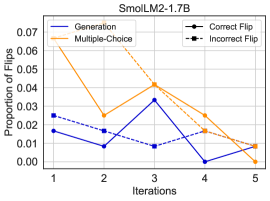
This line chart depicts the proportion of flips observed across different iterations for the SmolLM2-1.7B model. The chart compares the performance of "Generation" and "Multiple-Choice" methods, further categorized by whether the flips were "Correct," "Incorrect," or a combination of both. The x-axis represents the iteration number (1 to 5), and the y-axis represents the proportion of flips, ranging from 0.00 to 0.07.
### Components/Axes
* **Title:** SmolLM2-1.7B
* **X-axis Label:** Iterations (with markers at 1, 2, 3, 4, 5)
* **Y-axis Label:** Proportion of Flips (with markers at 0.00, 0.01, 0.02, 0.03, 0.04, 0.05, 0.06, 0.07)
* **Legend:**
* Generation (Blue Solid Line)
* Multiple-Choice (Orange Solid Line)
* Correct Flip (Black Dashed-Dotted Line)
* Incorrect Flip (Black Dashed Line)
### Detailed Analysis
The chart displays five data series, each representing a different condition.
* **Generation (Blue Solid Line):** This line starts at approximately 0.016 at iteration 1, decreases to approximately 0.011 at iteration 2, rises to approximately 0.032 at iteration 3, drops sharply to approximately 0.002 at iteration 4, and then increases slightly to approximately 0.006 at iteration 5.
* **Multiple-Choice (Orange Solid Line):** This line begins at approximately 0.063 at iteration 1, decreases to approximately 0.028 at iteration 2, increases to approximately 0.042 at iteration 3, decreases to approximately 0.031 at iteration 4, and finally drops to approximately 0.004 at iteration 5.
* **Correct Flip (Black Dashed-Dotted Line):** This line starts at approximately 0.023 at iteration 1, decreases to approximately 0.010 at iteration 2, decreases further to approximately 0.008 at iteration 3, increases slightly to approximately 0.012 at iteration 4, and then decreases to approximately 0.009 at iteration 5.
* **Incorrect Flip (Black Dashed Line):** This line begins at approximately 0.021 at iteration 1, decreases to approximately 0.011 at iteration 2, decreases to approximately 0.007 at iteration 3, increases to approximately 0.011 at iteration 4, and then decreases to approximately 0.007 at iteration 5.
### Key Observations
* The "Multiple-Choice" method consistently exhibits a higher proportion of flips compared to the "Generation" method, especially in the initial iterations.
* Both "Multiple-Choice" and "Generation" show a decreasing trend in the proportion of flips as the number of iterations increases, suggesting improvement in model stability or convergence.
* The "Correct Flip" line remains relatively stable throughout the iterations, while the "Incorrect Flip" line also shows a decreasing trend.
* The most significant drop in both "Generation" and "Multiple-Choice" occurs between iterations 3 and 4.
### Interpretation
The data suggests that the SmolLM2-1.7B model improves its performance (as indicated by a decreasing proportion of flips) with each iteration. The "Multiple-Choice" method initially demonstrates a higher rate of change (flips) compared to "Generation," potentially indicating a more exploratory or sensitive learning process. The decrease in both "Correct" and "Incorrect" flips over iterations suggests that the model is becoming more confident and stable in its predictions. The sharp drop between iterations 3 and 4 could represent a critical learning phase or a point of convergence where the model significantly refines its parameters. The consistent difference between the "Correct" and "Incorrect" flip lines indicates that the model is learning to avoid incorrect changes, but still makes some. The chart provides insights into the learning dynamics of the model and the effectiveness of different methods ("Generation" vs. "Multiple-Choice") in guiding the learning process.