## Line Chart: SmolLM2-1.7B - Proportion of Flips Over Iterations
### Overview
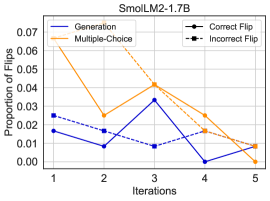
The image is a line chart titled "SmolLM2-1.7B". It plots the "Proportion of Flips" against the number of "Iterations" (from 1 to 5) for four distinct data series. The chart compares the performance or behavior of different methods or conditions over a sequence of iterations.
### Components/Axes
* **Chart Title:** SmolLM2-1.7B (Top Center)
* **Y-Axis:**
* **Label:** Proportion of Flips (Left side, vertical)
* **Scale:** Linear, ranging from 0.00 to 0.07, with major tick marks at 0.00, 0.01, 0.02, 0.03, 0.04, 0.05, 0.06, 0.07.
* **X-Axis:**
* **Label:** Iterations (Bottom, horizontal)
* **Scale:** Discrete, with markers at 1, 2, 3, 4, and 5.
* **Legend:** Located in the top-right corner of the plot area. It defines four series:
1. **Generation:** Solid blue line.
2. **Multiple-Choice:** Solid orange line.
3. **Correct Flip:** Dashed blue line with circular markers.
4. **Incorrect Flip:** Dashed black line with square markers.
### Detailed Analysis
**Trend Verification & Data Point Extraction:**
1. **Generation (Solid Blue Line):**
* **Trend:** Volatile. Starts low, dips, spikes sharply at iteration 3, then plummets before a slight recovery.
* **Data Points (Approximate):**
* Iteration 1: ~0.018
* Iteration 2: ~0.010
* Iteration 3: ~0.035 (Peak)
* Iteration 4: ~0.002 (Lowest point)
* Iteration 5: ~0.010
2. **Multiple-Choice (Solid Orange Line):**
* **Trend:** Overall downward trend after an initial sharp drop. Starts as the highest value, decreases, has a secondary peak at iteration 3, then declines steadily.
* **Data Points (Approximate):**
* Iteration 1: ~0.065 (Highest value on the chart)
* Iteration 2: ~0.025
* Iteration 3: ~0.040 (Secondary peak)
* Iteration 4: ~0.025
* Iteration 5: ~0.005
3. **Correct Flip (Dashed Blue Line with Circles):**
* **Trend:** Generally decreasing with a small rebound at iteration 4.
* **Data Points (Approximate):**
* Iteration 1: ~0.025
* Iteration 2: ~0.018
* Iteration 3: ~0.009
* Iteration 4: ~0.018
* Iteration 5: ~0.008
4. **Incorrect Flip (Dashed Black Line with Squares):**
* **Trend:** Fluctuates at a low level, generally below the "Correct Flip" line except at iteration 3.
* **Data Points (Approximate):**
* Iteration 1: ~0.018
* Iteration 2: ~0.009
* Iteration 3: ~0.018
* Iteration 4: ~0.009
* Iteration 5: ~0.008
### Key Observations
1. **Dominant Series:** The "Multiple-Choice" method begins with a significantly higher proportion of flips (~0.065) than all other series at iteration 1.
2. **Convergence at Iteration 3:** All four data series show a local peak or notable change at iteration 3. "Generation" reaches its maximum, "Multiple-Choice" has a secondary peak, and "Incorrect Flip" rises to meet "Correct Flip".
3. **Final Convergence:** By iteration 5, the proportion of flips for all four series converges to a very low range, between approximately 0.005 and 0.010.
4. **Correct vs. Incorrect Flips:** The "Correct Flip" proportion is generally higher than or equal to the "Incorrect Flip" proportion across iterations, except at iteration 3 where they are approximately equal (~0.018).
5. **Volatility:** The "Generation" series exhibits the most dramatic volatility, with the largest single-iteration change (a drop from ~0.035 to ~0.002 between iterations 3 and 4).
### Interpretation
This chart likely tracks the stability or error-correction behavior of the "SmolLM2-1.7B" model across iterative refinement steps. "Flips" probably refer to changes in the model's output or predictions between iterations.
* **Method Comparison:** The "Multiple-Choice" approach starts with high instability (many flips) but improves rapidly. The "Generation" approach is highly unstable mid-process (iteration 3) but achieves the lowest flip rate by iteration 4.
* **Process Dynamics:** The synchronized activity at iteration 3 suggests a critical point in the iterative process where all methods undergo significant adjustment. The general downward trend indicates that, regardless of the method, the model's outputs stabilize as iterations progress.
* **Error Quality:** The fact that "Correct Flip" rates are typically higher than "Incorrect Flip" rates suggests that when the model changes its output, it is more often making a correction towards a better answer than introducing a new error. The convergence of all metrics to a low value by iteration 5 implies the process reaches a stable state.
* **Underlying Question:** The data prompts investigation into why the "Generation" method has such a pronounced spike and subsequent crash at iterations 3-4, and whether the "Multiple-Choice" method's high initial flip rate is a necessary cost for its later stability.