## Line Graph: SmolLM2-1.7B
### Overview
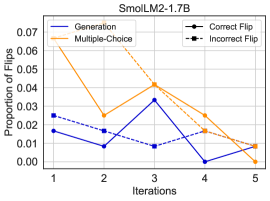
The image is a line graph titled "SmolLM2-1.7B" depicting the proportion of flips (correct and incorrect) across five iterations. Two data series are plotted: "Generation" (blue solid line) and "Multiple-Choice" (orange dashed line). The y-axis represents the proportion of flips (0.00 to 0.07), and the x-axis represents iterations (1 to 5). A legend in the top-right corner distinguishes between "Correct Flip" (filled circle) and "Incorrect Flip" (open circle).
### Components/Axes
- **X-axis (Iterations)**: Labeled "Iterations" with values 1 to 5.
- **Y-axis (Proportion of Flips)**: Labeled "Proportion of Flips" with values from 0.00 to 0.07.
- **Legend**: Located in the top-right corner. Entries include:
- "Generation" (solid blue line)
- "Multiple-Choice" (dashed orange line)
- "Correct Flip" (filled circle)
- "Incorrect Flip" (open circle)
### Detailed Analysis
- **Generation (Blue Solid Line)**:
- Iteration 1: ~0.02
- Iteration 2: ~0.01
- Iteration 3: ~0.005
- Iteration 4: ~0.002
- Iteration 5: ~0.005
- **Trend**: U-shaped curve, dipping to a minimum at iteration 4 before rising slightly at iteration 5.
- **Multiple-Choice (Orange Dashed Line)**:
- Iteration 1: ~0.06
- Iteration 2: ~0.03
- Iteration 3: ~0.04
- Iteration 4: ~0.02
- Iteration 5: ~0.01
- **Trend**: General downward trend with a peak at iteration 3.
- **Markers**:
- "Correct Flip" (filled circles) are consistently higher than "Incorrect Flip" (open circles) for both lines. For example:
- At iteration 1, "Correct Flip" (blue) is ~0.02, while "Incorrect Flip" (blue) is ~0.01.
- At iteration 3, "Correct Flip" (orange) is ~0.04, while "Incorrect Flip" (orange) is ~0.02.
### Key Observations
1. **Generation** shows a U-shaped trend, with the lowest proportion of flips at iteration 4 (~0.002) and a slight recovery at iteration 5 (~0.005).
2. **Multiple-Choice** starts with the highest proportion of flips (~0.06 at iteration 1) but decreases steadily, with a minor peak at iteration 3 (~0.04).
3. "Correct Flip" values are consistently higher than "Incorrect Flip" values for both lines, suggesting a higher frequency of correct flips over time.
### Interpretation
The data suggests that both "Generation" and "Multiple-Choice" methods experience a reduction in the proportion of flips as iterations increase. However, "Multiple-Choice" begins with a significantly higher proportion of flips, which declines more sharply than "Generation." The U-shaped trend in "Generation" may indicate an initial adjustment period followed by stabilization. The consistent dominance of "Correct Flip" over "Incorrect Flip" implies that the model's performance improves in accuracy over iterations, with fewer incorrect flips. The peak in "Multiple-Choice" at iteration 3 could reflect a temporary increase in variability or a specific event in the data not explained by the graph. The overall trend highlights the importance of iteration count in refining model outputs, with "Generation" showing more stability compared to "Multiple-Choice."