## Line Graphs: Validation Reward vs. Step for Different Models
### Overview
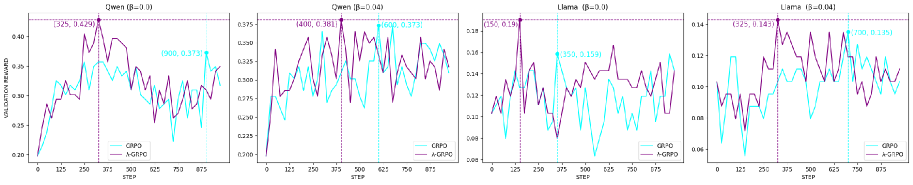
The image presents four line graphs comparing the performance of two models, CRPO (cyan) and A-GRPO (purple), across different scenarios labeled as "Qwen (B=0.0)", "Qwen (B=0.04)", "Llama (B=0.0)", and "Llama (B=0.04)". Each graph plots validation reward against the step number, showing how the models learn and perform over time. Vertical dashed lines mark specific steps, and coordinate points are annotated on the graphs.
### Components/Axes
* **X-axis:** "STEP" - Ranges from 0 to 875 in each graph, with tick marks at intervals of 125.
* **Y-axis:** "VALIDATION REWARD" - Ranges vary for each graph, but generally span from approximately 0.06 to 0.45.
* **Legends:** Located at the bottom-center of each graph.
* Cyan line: "CRPO"
* Purple line: "A-GRPO"
* **Titles:** Located at the top of each graph.
* Top-left: "Qwen (B=0.0)"
* Top-middle-left: "Qwen [B=0.04)"
* Top-middle-right: "Llama (B=0.0)"
* Top-right: "Llama (B=0.04]"
### Detailed Analysis
**1. Qwen (B=0.0)**
* **CRPO (Cyan):** Starts around 0.20, increases to approximately 0.36 by step 375, then decreases and fluctuates between 0.28 and 0.36 until step 875.
* **A-GRPO (Purple):** Starts around 0.20, increases sharply to a peak of 0.429 at step 325, then decreases and fluctuates between 0.25 and 0.40 until step 875.
* **Key Data Points:**
* A-GRPO Peak: (325, 0.429)
* CRPO Point: (900, 0.373) - Note: 900 is outside the x-axis range, likely an annotation error.
**2. Qwen (B=0.04)**
* **CRPO (Cyan):** Starts around 0.20, increases to approximately 0.373 by step 600, then decreases and fluctuates between 0.25 and 0.35 until step 875.
* **A-GRPO (Purple):** Starts around 0.20, increases sharply to a peak of 0.381 at step 400, then decreases and fluctuates between 0.25 and 0.40 until step 875.
* **Key Data Points:**
* A-GRPO Peak: (400, 0.381)
* CRPO Point: (600, 0.373)
**3. Llama (B=0.0)**
* **CRPO (Cyan):** Starts around 0.08, increases to approximately 0.159 by step 350, then decreases and fluctuates between 0.08 and 0.16 until step 875.
* **A-GRPO (Purple):** Starts around 0.08, increases sharply to a peak of 0.19 at step 150, then decreases and fluctuates between 0.10 and 0.14 until step 875.
* **Key Data Points:**
* A-GRPO Peak: (150, 0.19)
* CRPO Point: (350, 0.159)
**4. Llama (B=0.04)**
* **CRPO (Cyan):** Starts around 0.06, increases to approximately 0.135 by step 700, then decreases and fluctuates between 0.06 and 0.12 until step 875.
* **A-GRPO (Purple):** Starts around 0.06, increases sharply to a peak of 0.143 at step 325, then decreases and fluctuates between 0.08 and 0.14 until step 875.
* **Key Data Points:**
* A-GRPO Peak: (325, 0.143)
* CRPO Point: (700, 0.135)
### Key Observations
* In all four scenarios, A-GRPO (purple) initially reaches a higher peak validation reward compared to CRPO (cyan).
* The "Qwen" scenarios show higher validation reward values than the "Llama" scenarios.
* Both models exhibit fluctuations in validation reward after reaching their initial peaks, indicating ongoing learning and adaptation.
### Interpretation
The graphs suggest that A-GRPO initially learns faster and achieves higher peak performance compared to CRPO in these scenarios. However, both models demonstrate a degree of instability and fluctuation after their initial learning phase. The difference in performance between "Qwen" and "Llama" scenarios indicates that the models' effectiveness is influenced by the specific task or dataset. The parameter "B" (0.0 vs. 0.04) also appears to influence the models' performance, although the exact nature of this influence is not clear from the graphs alone. The annotations, while helpful, contain a potential error in the "Qwen (B=0.0)" graph, where the x-coordinate of the CRPO point exceeds the axis limit.