\n
## Line Chart: Validation Reward vs. Step for Different Models
### Overview
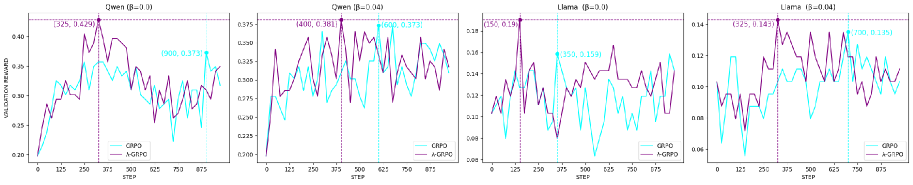
The image presents four separate line charts, each depicting the relationship between "Validation Reward" and "Step" for different models: Owen (with β=0.1), Owen (with β=0.04), Llama (with β=0.1), and Llama (with β=0.04). Each chart displays two lines representing "CRPO" and "A-GPO" algorithms. The charts appear to track the performance of these algorithms over a series of steps, as measured by the validation reward.
### Components/Axes
* **X-axis:** "STEP" ranging from 0 to 800.
* **Y-axis:** "VALIDATION REWARD". The scales vary for each chart.
* Owen (β=0.1): 0.20 to 3.25
* Owen (β=0.04): 0.225 to 3.75
* Llama (β=0.1): 0.08 to 0.150
* Llama (β=0.04): 0.04 to 0.14
* **Lines:** Two lines are present in each chart:
* "CRPO" (Purple/Violet)
* "A-GPO" (Cyan/Turquoise)
* **Titles:** Each chart has a title indicating the model name and β value.
* **Annotations:** Each chart has annotations indicating the maximum validation reward achieved by each algorithm.
### Detailed Analysis or Content Details
**1. Owen (β=0.1)**
* **CRPO:** The line starts at approximately 0.25, increases to a peak of approximately 3.25 at step 250, then fluctuates between approximately 1.90 and 3.00 for the remainder of the steps.
* **A-GPO:** The line starts at approximately 0.25, increases to a peak of approximately 1.90 at step 250, then fluctuates between approximately 0.75 and 1.90 for the remainder of the steps.
* **Annotations:** CRPO max reward: 3.25 at step 250. A-GPO max reward: 1.90 at step 250.
**2. Owen (β=0.04)**
* **CRPO:** The line starts at approximately 0.25, increases to a peak of approximately 3.75 at step 250, then fluctuates between approximately 1.90 and 3.75 for the remainder of the steps.
* **A-GPO:** The line starts at approximately 0.25, increases to a peak of approximately 1.90 at step 250, then fluctuates between approximately 0.75 and 1.90 for the remainder of the steps.
* **Annotations:** CRPO max reward: 4.00 at step 250. A-GPO max reward: 1.975 at step 250.
**3. Llama (β=0.1)**
* **CRPO:** The line starts at approximately 0.10, increases to a peak of approximately 0.150 at step 250, then fluctuates between approximately 0.08 and 0.150 for the remainder of the steps.
* **A-GPO:** The line starts at approximately 0.08, increases to a peak of approximately 0.125 at step 250, then fluctuates between approximately 0.06 and 0.125 for the remainder of the steps.
* **Annotations:** CRPO max reward: 0.150 at step 250. A-GPO max reward: 0.125 at step 250.
**4. Llama (β=0.04)**
* **CRPO:** The line starts at approximately 0.06, increases to a peak of approximately 0.145 at step 250, then fluctuates between approximately 0.06 and 0.145 for the remainder of the steps.
* **A-GPO:** The line starts at approximately 0.04, increases to a peak of approximately 0.11 at step 250, then fluctuates between approximately 0.04 and 0.11 for the remainder of the steps.
* **Annotations:** CRPO max reward: 0.145 at step 250. A-GPO max reward: 0.11 at step 250.
### Key Observations
* **CRPO consistently outperforms A-GPO** across all models and β values, as indicated by higher validation rewards.
* **Owen models achieve significantly higher validation rewards** compared to Llama models.
* **The peak validation reward generally occurs around step 250** for both algorithms in all charts.
* **Lower β values (0.04) seem to result in slightly higher peak rewards for Owen**, but the difference is not substantial.
* **The fluctuations in validation reward after step 250 suggest instability** or ongoing learning/adaptation.
### Interpretation
The data suggests that the CRPO algorithm is more effective than the A-GPO algorithm in maximizing validation reward for both Owen and Llama models. The Owen model consistently achieves higher rewards, indicating it may be better suited for this task or have a more effective learning process. The β parameter appears to have a minor influence on performance, with lower values potentially leading to slightly higher peak rewards in the Owen model. The fluctuations after step 250 suggest that the learning process is not fully converged and that further steps could potentially lead to improved performance. The difference in scale between the Owen and Llama charts indicates that the models operate in different reward spaces or have different inherent capabilities. The annotations pinpoint the step at which the maximum reward is achieved, providing a useful metric for comparing the algorithms' efficiency.