## Diagram: Acoustic Field Measurement
### Overview
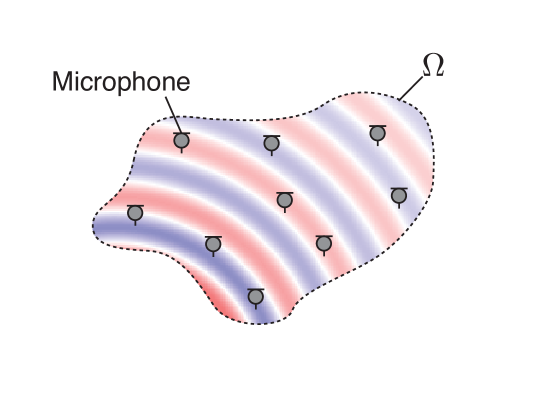
The image depicts a schematic representation of an acoustic field measurement setup. It shows an enclosed area, denoted by Ω, within which a series of microphones are positioned to capture the spatial distribution of an acoustic wave. The wave is visualized as alternating bands of red and blue, representing areas of high and low pressure, respectively.
### Components/Axes
* **Enclosed Area:** The area within which the acoustic field is measured, bounded by a dashed line and labeled "Ω" in the top-right corner.
* **Microphones:** Nine microphones are distributed within the enclosed area. Each microphone is represented by a small gray circle with a vertical line extending upwards. One microphone in the top-left corner is explicitly labeled "Microphone" with an arrow pointing to it.
* **Acoustic Wave:** The acoustic wave is visualized as alternating bands of red and blue, indicating areas of high and low pressure, respectively. The bands are roughly parallel and traverse the enclosed area.
### Detailed Analysis or Content Details
* **Microphone Positions:** The microphones are positioned at various locations within the enclosed area. Their spatial distribution appears to be somewhat regular, but not perfectly uniform.
* **Wave Pattern:** The acoustic wave pattern consists of alternating red and blue bands. The bands are oriented roughly diagonally from the bottom-left to the top-right of the enclosed area. The intensity of the colors fades towards the edges of the bands, suggesting a gradient in pressure.
* **Enclosed Area Shape:** The enclosed area has an irregular, somewhat amoeba-like shape. The boundary is defined by a dashed line.
### Key Observations
* The diagram illustrates a typical setup for measuring the spatial distribution of an acoustic field.
* The alternating red and blue bands represent the pressure variations associated with the acoustic wave.
* The microphones are strategically positioned to capture the spatial characteristics of the wave.
### Interpretation
The diagram represents a scenario where an acoustic field is being measured within a defined space (Ω). The alternating red and blue bands likely represent the peaks and troughs of a sound wave, with red indicating areas of higher pressure and blue indicating areas of lower pressure. The microphones are positioned to sample the sound field at various points, allowing for a reconstruction or analysis of the wave's spatial characteristics. The irregular shape of the enclosed area (Ω) suggests that the measurement is being conducted in a non-ideal environment, where reflections and other acoustic phenomena may be present.