\n
## Diagram: Sound Wave Interference Pattern
### Overview
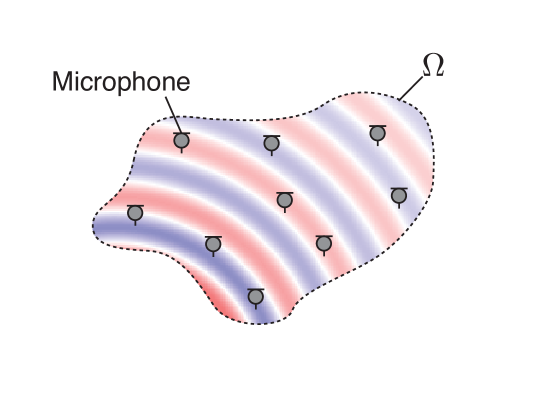
The image depicts a visual representation of sound wave interference, likely illustrating the principle of constructive and destructive interference. It shows a region (Ω) with alternating bands of color (red and blue/purple) representing areas of high and low sound pressure, respectively. Several microphone symbols are placed within this region.
### Components/Axes
* **Ω:** Label indicating the region of sound wave interference. Positioned in the top-right corner.
* **Microphone:** Label pointing to a microphone symbol. Positioned in the top-left corner.
* **Color Bands:** Alternating red and blue/purple bands representing areas of constructive (red) and destructive (blue/purple) interference.
* **Microphone Symbols:** Small circles with a line through them, representing microphone placements. Distributed throughout the region Ω.
### Detailed Analysis or Content Details
The diagram shows a roughly oval-shaped region (Ω) filled with alternating bands of red and blue/purple. The bands are not perfectly straight but are curved and wave-like. There are approximately 11 microphone symbols distributed within the region.
* **Microphone 1:** Located in the top-left, within a red band.
* **Microphone 2:** Located slightly below and to the right of Microphone 1, within a blue/purple band.
* **Microphone 3:** Located in the top-right, within a red band.
* **Microphone 4:** Located below Microphone 3, within a blue/purple band.
* **Microphone 5:** Located in the center-left, within a blue/purple band.
* **Microphone 6:** Located in the center, within a red band.
* **Microphone 7:** Located below Microphone 6, within a blue/purple band.
* **Microphone 8:** Located in the bottom-left, within a blue/purple band.
* **Microphone 9:** Located to the right of Microphone 8, within a red band.
* **Microphone 10:** Located in the bottom-right, within a blue/purple band.
* **Microphone 11:** Located slightly above Microphone 10, within a red band.
The region Ω is outlined with a dashed line. The color bands appear to be roughly parallel to each other, though with some curvature.
### Key Observations
The microphones are strategically placed within both the red and blue/purple bands, suggesting an investigation into the sound pressure levels at different points within the interference pattern. The alternating color bands clearly demonstrate the spatial variation of sound intensity due to interference.
### Interpretation
This diagram illustrates the concept of sound wave interference. The red bands represent areas where sound waves constructively interfere, resulting in higher sound pressure (louder sound). The blue/purple bands represent areas where sound waves destructively interfere, resulting in lower sound pressure (quieter sound). The placement of the microphones suggests an experiment or simulation to measure the sound pressure levels at various points within this interference pattern. The dashed outline (Ω) defines the area where the interference pattern is being observed. The diagram is a qualitative representation and does not provide specific numerical data about sound pressure levels or frequencies. It serves to visually explain the phenomenon of interference.