## Line Chart: Mistral-7B Model Performance Comparison
### Overview
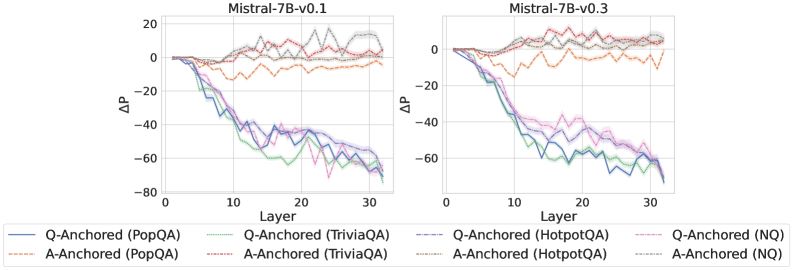
The image presents two line charts comparing the performance of Mistral-7B-v0.1 and Mistral-7B-v0.3 models across different question answering tasks. The charts display the change in performance (ΔP) as a function of the layer number in the model. Each line represents a different question answering task, anchored either to the question (Q-Anchored) or the answer (A-Anchored).
### Components/Axes
* **Titles:** The left chart is titled "Mistral-7B-v0.1" and the right chart is titled "Mistral-7B-v0.3".
* **X-axis:** Labeled "Layer", with a scale from 0 to 30 in increments of 10.
* **Y-axis:** Labeled "ΔP", with a scale from -80 to 20 in increments of 20.
* **Legend:** Located at the bottom of the charts, mapping line styles and colors to question answering tasks:
* Blue solid line: Q-Anchored (PopQA)
* Brown dashed line: A-Anchored (PopQA)
* Green dotted line: Q-Anchored (TriviaQA)
* Pink dashed-dotted line: A-Anchored (TriviaQA)
* Red dashed line: Q-Anchored (HotpotQA)
* Orange dashed-double-dotted line: A-Anchored (HotpotQA)
* Purple dashed line: Q-Anchored (NQ)
* Gray dotted line: A-Anchored (NQ)
### Detailed Analysis
**Mistral-7B-v0.1 (Left Chart):**
* **Q-Anchored (PopQA) (Blue solid line):** Starts at approximately 0, decreases to around -60 by layer 30.
* **A-Anchored (PopQA) (Brown dashed line):** Starts at approximately 0, decreases slightly to around -10, then fluctuates between -5 and -15.
* **Q-Anchored (TriviaQA) (Green dotted line):** Starts at approximately 0, decreases to around -60 by layer 30.
* **A-Anchored (TriviaQA) (Pink dashed-dotted line):** Starts at approximately 0, decreases to around -50 by layer 30.
* **Q-Anchored (HotpotQA) (Red dashed line):** Starts at approximately 0, increases to around 10 by layer 30.
* **A-Anchored (HotpotQA) (Orange dashed-double-dotted line):** Starts at approximately 0, decreases to around -15, then fluctuates between -5 and -15.
* **Q-Anchored (NQ) (Purple dashed line):** Starts at approximately 0, decreases to around -70 by layer 30.
* **A-Anchored (NQ) (Gray dotted line):** Starts at approximately 0, increases to around 15 by layer 30.
**Mistral-7B-v0.3 (Right Chart):**
* **Q-Anchored (PopQA) (Blue solid line):** Starts at approximately 0, decreases to around -60 by layer 30.
* **A-Anchored (PopQA) (Brown dashed line):** Starts at approximately 0, decreases slightly to around -10, then fluctuates between -5 and -15.
* **Q-Anchored (TriviaQA) (Green dotted line):** Starts at approximately 0, decreases to around -60 by layer 30.
* **A-Anchored (TriviaQA) (Pink dashed-dotted line):** Starts at approximately 0, decreases to around -50 by layer 30.
* **Q-Anchored (HotpotQA) (Red dashed line):** Starts at approximately 0, increases to around 10 by layer 30.
* **A-Anchored (HotpotQA) (Orange dashed-double-dotted line):** Starts at approximately 0, decreases to around -15, then fluctuates between -5 and -15.
* **Q-Anchored (NQ) (Purple dashed line):** Starts at approximately 0, decreases to around -70 by layer 30.
* **A-Anchored (NQ) (Gray dotted line):** Starts at approximately 0, increases to around 15 by layer 30.
### Key Observations
* The performance trends for each question answering task are very similar between Mistral-7B-v0.1 and Mistral-7B-v0.3.
* Q-Anchored (PopQA), Q-Anchored (TriviaQA), and Q-Anchored (NQ) show a significant decrease in ΔP as the layer number increases.
* A-Anchored (PopQA) and A-Anchored (HotpotQA) show a slight decrease in ΔP as the layer number increases.
* Q-Anchored (HotpotQA) and A-Anchored (NQ) show an increase in ΔP as the layer number increases.
### Interpretation
The charts suggest that the performance of the Mistral-7B model on different question answering tasks varies significantly depending on whether the task is anchored to the question or the answer. The decrease in ΔP for Q-Anchored tasks as the layer number increases could indicate that the model struggles to maintain performance on these tasks as it processes deeper layers. Conversely, the increase in ΔP for A-Anchored (NQ) and Q-Anchored (HotpotQA) tasks suggests that the model's performance improves with deeper processing for these specific tasks. The similarity in trends between Mistral-7B-v0.1 and Mistral-7B-v0.3 indicates that the performance characteristics are consistent across these versions of the model.