## Line Charts: Mistral-7B Model Layer-wise Performance Change (ΔP)
### Overview
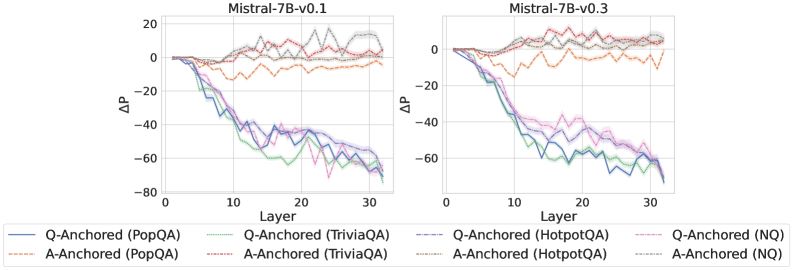
The image displays two side-by-side line charts comparing the layer-wise change in performance (ΔP) for two versions of the Mistral-7B language model: "Mistral-7B-v0.1" (left) and "Mistral-7B-v0.3" (right). Each chart plots ΔP against the model's layer number (0 to 30+). The data is broken down by two anchoring methods (Q-Anchored and A-Anchored) across four different question-answering datasets (PopQA, TriviaQA, HotpotQA, NQ).
### Components/Axes
* **Chart Titles:** Centered above each plot: "Mistral-7B-v0.1" (left) and "Mistral-7B-v0.3" (right).
* **X-Axis:** Labeled "Layer". Linear scale with major tick marks at 0, 10, 20, and 30.
* **Y-Axis:** Labeled "ΔP". Linear scale with major tick marks at -80, -60, -40, -20, 0, and 20.
* **Legend:** Positioned at the bottom, spanning the width of both charts. It defines eight data series using a combination of color and line style:
* **Solid Lines (Q-Anchored):**
* Blue: Q-Anchored (PopQA)
* Green: Q-Anchored (TriviaQA)
* Purple: Q-Anchored (HotpotQA)
* Pink: Q-Anchored (NQ)
* **Dashed Lines (A-Anchored):**
* Orange: A-Anchored (PopQA)
* Red: A-Anchored (TriviaQA)
* Gray: A-Anchored (HotpotQA)
* Light Blue: A-Anchored (NQ)
### Detailed Analysis
**Mistral-7B-v0.1 (Left Chart):**
* **Q-Anchored Series (Solid Lines):** All four lines (Blue/PopQA, Green/TriviaQA, Purple/HotpotQA, Pink/NQ) follow a very similar, pronounced downward trend. They start near ΔP = 0 at Layer 0, begin a steep decline around Layer 5-10, and continue to fall, reaching values between approximately -60 and -75 by Layer 30. The lines are tightly clustered, with the Green (TriviaQA) and Pink (NQ) lines often at the lower bound of the cluster.
* **A-Anchored Series (Dashed Lines):** These lines exhibit a fundamentally different pattern. They fluctuate around ΔP = 0 throughout all layers, showing no consistent downward or upward trend. The Orange (PopQA) and Red (TriviaQA) lines show more volatility, with peaks reaching near +10 and troughs near -15. The Gray (HotpotQA) and Light Blue (NQ) lines are slightly more stable but still oscillate within a range of roughly -10 to +15.
**Mistral-7B-v0.3 (Right Chart):**
* **Q-Anchored Series (Solid Lines):** The downward trend is again present but appears slightly less severe compared to v0.1. The lines start near 0, begin declining around Layer 10, and reach values between approximately -50 and -65 by Layer 30. The clustering is similar, with Green (TriviaQA) and Pink (NQ) often among the lowest.
* **A-Anchored Series (Dashed Lines):** These lines are notably more stable than in v0.1. They hover very close to ΔP = 0 across all layers, with significantly reduced amplitude of fluctuation. Most lines stay within a narrow band of approximately -5 to +5. The Orange (PopQA) line shows the most deviation, with a slight negative bias in the middle layers.
### Key Observations
1. **Fundamental Dichotomy:** There is a stark and consistent difference between the behavior of Q-Anchored and A-Anchored methods across both model versions. Q-Anchored performance degrades significantly with layer depth, while A-Anchored performance remains stable.
2. **Version Comparison (v0.1 vs. v0.3):** The A-Anchored lines in v0.3 are markedly more stable (closer to zero with less variance) than in v0.1. The Q-Anchored lines in v0.3 show a similar pattern of degradation but may start their decline slightly later and end at a marginally higher (less negative) ΔP.
3. **Dataset Similarity:** Within each anchoring method, the four datasets (PopQA, TriviaQA, HotpotQA, NQ) produce highly correlated trends. Their lines are tightly grouped, suggesting the observed layer-wise effect is robust across these different QA benchmarks.
4. **Spatial Grounding:** The legend is placed centrally at the bottom, clearly associating each color/style with its label. In the charts, the solid (Q-Anchored) lines occupy the lower half (negative ΔP) after the initial layers, while the dashed (A-Anchored) lines occupy the central band around zero.
### Interpretation
This data suggests a critical insight into the internal mechanics of the Mistral-7B model across its versions. The metric ΔP likely represents a change in some performance measure (e.g., probability, accuracy) when using different "anchoring" techniques.
* **Q-Anchored vs. A-Anchored:** The consistent degradation of Q-Anchored performance in deeper layers implies that the model's processing of the *question* (Q) becomes less effective or more perturbed as information flows through the network. In contrast, the stability of A-Anchored performance suggests the model's handling of the *answer* (A) context is robust to depth. This could indicate that deeper layers specialize in or are more sensitive to answer-related processing.
* **Model Evolution (v0.1 to v0.3):** The improved stability of the A-Anchored lines in v0.3 suggests that this model version has been refined to maintain more consistent performance on answer-anchored tasks across its depth, representing a potential architectural or training improvement.
* **Robustness Across Tasks:** The tight clustering of lines for different datasets indicates that this layer-wise phenomenon is a general property of the model's architecture and the anchoring methods, not an artifact of a specific question set.
**In summary, the charts reveal a fundamental asymmetry in how the model processes question versus answer information across its layers, with evidence of iterative improvement between model versions in stabilizing answer-based processing.**