## Line Chart: ΔP Across Layers for Mistral-7B Models (v0.1 and v0.3)
### Overview
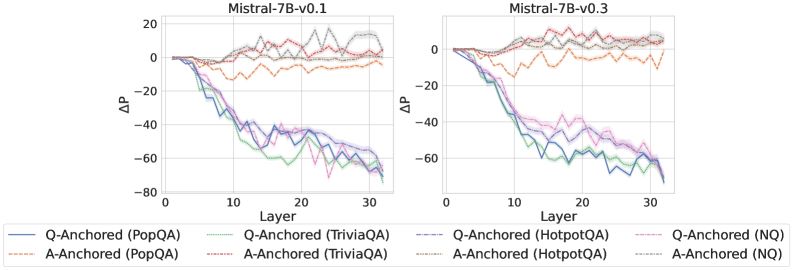
The image contains two side-by-side line charts comparing the ΔP metric across 30 layers for two versions of the Mistral-7B model (v0.1 and v0.3). Each chart includes six data series represented by distinct colored lines, with a legend at the bottom-left corner. The y-axis measures ΔP (ranging from -80 to 20), and the x-axis represents layer numbers (0 to 30).
---
### Components/Axes
- **Y-Axis**: ΔP (values from -80 to 20, increments of 20)
- **X-Axis**: Layer (0 to 30, increments of 10)
- **Legend**: Located at bottom-left, with six entries:
1. **Q-Anchored (PopQA)**: Solid blue line
2. **A-Anchored (PopQA)**: Dashed orange line
3. **Q-Anchored (TriviaQA)**: Dotted green line
4. **A-Anchored (TriviaQA)**: Dash-dot red line
5. **Q-Anchored (HotpotQA)**: Solid purple line
6. **A-Anchored (HotpotQA)**: Dotted gray line
7. **Q-Anchored (NQ)**: Dash-dot pink line
8. **A-Anchored (NQ)**: Solid gray line
---
### Detailed Analysis
#### Left Panel (Mistral-7B-v0.1)
- **Q-Anchored (PopQA)**: Starts at 0, declines sharply to ~-60 by layer 30 (blue line).
- **A-Anchored (PopQA)**: Starts at 0, fluctuates minimally, ending near 0 (orange dashed line).
- **Q-Anchored (TriviaQA)**: Drops from 0 to ~-50 by layer 30 (dotted green line).
- **A-Anchored (TriviaQA)**: Peaks at ~+10 around layer 10, then declines to ~-10 (red dash-dot line).
- **Q-Anchored (HotpotQA)**: Declines from 0 to ~-50 by layer 30 (solid purple line).
- **A-Anchored (HotpotQA)**: Starts at 0, fluctuates between +5 and -5 (dotted gray line).
- **Q-Anchored (NQ)**: Drops from 0 to ~-55 by layer 30 (dash-dot pink line).
- **A-Anchored (NQ)**: Starts at 0, fluctuates between +5 and -5 (solid gray line).
#### Right Panel (Mistral-7B-v0.3)
- **Q-Anchored (PopQA)**: Declines from 0 to ~-50 by layer 30 (blue line).
- **A-Anchored (PopQA)**: Starts at 0, fluctuates minimally, ending near 0 (orange dashed line).
- **Q-Anchored (TriviaQA)**: Drops from 0 to ~-45 by layer 30 (dotted green line).
- **A-Anchored (TriviaQA)**: Peaks at ~+15 around layer 10, then declines to ~-5 (red dash-dot line).
- **Q-Anchored (HotpotQA)**: Declines from 0 to ~-40 by layer 30 (solid purple line).
- **A-Anchored (HotpotQA)**: Starts at 0, fluctuates between +5 and -5 (dotted gray line).
- **Q-Anchored (NQ)**: Drops from 0 to ~-50 by layer 30 (dash-dot pink line).
- **A-Anchored (NQ)**: Starts at 0, fluctuates between +5 and -5 (solid gray line).
---
### Key Observations
1. **General Trend**: Most Q-Anchored lines show a consistent downward trend in ΔP across layers, while A-Anchored lines remain relatively stable or exhibit minor fluctuations.
2. **Version Differences**:
- v0.3 shows smaller ΔP magnitudes compared to v0.1 for most Q-Anchored lines (e.g., Q-Anchored (PopQA) drops from -60 to -50).
- A-Anchored (TriviaQA) in v0.3 has a higher peak (~+15 vs. +10 in v0.1).
3. **Anomalies**:
- A-Anchored (TriviaQA) in v0.1 has a pronounced peak at layer 10.
- Q-Anchored (HotpotQA) in v0.1 shows a sharp dip at layer 15.
---
### Interpretation
The charts suggest that anchoring strategies (Q-Anchored vs. A-Anchored) and datasets (PopQA, TriviaQA, HotpotQA, NQ) influence ΔP trends across model layers. The reduction in ΔP magnitude in v0.3 compared to v0.1 implies improved stability or performance in the updated model version. Notably, Q-Anchored methods exhibit larger ΔP declines, potentially indicating greater sensitivity to layer depth or dataset-specific challenges. The stability of A-Anchored lines suggests robustness to layer variations. These trends could reflect architectural changes in the model versions or dataset-specific optimization effects.