\n
## Chart: Optimal Error Rate vs. Alpha for Different Activation Functions and Inference Methods
### Overview
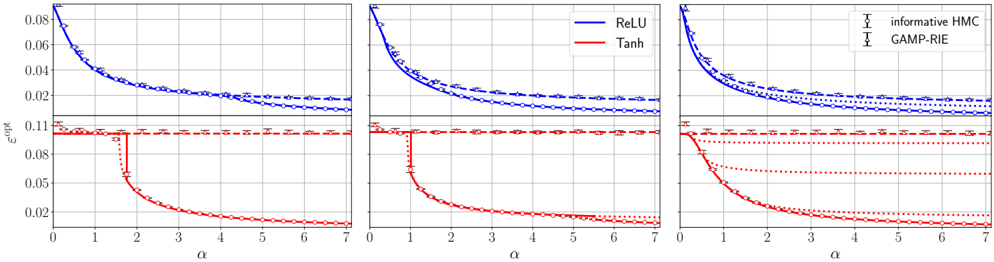
This image presents three line charts, arranged horizontally, displaying the relationship between the optimal error rate (ε<sub>opt</sub>) and the alpha (α) parameter. Each chart compares the performance of two activation functions, ReLU and Tanh, under two different inference methods, Informative HMC and GAMP-RIE. The charts share identical axes and scales, allowing for direct comparison across the three panels.
### Components/Axes
* **X-axis:** α (Alpha) - Ranging from 0 to 7, with tick marks at integer values.
* **Y-axis:** ε<sub>opt</sub> (Optimal Error Rate) - Ranging from 0 to 0.08, with tick marks at 0.02 intervals.
* **Lines:**
* ReLU (Blue) - Represents the optimal error rate for the ReLU activation function.
* Tanh (Red) - Represents the optimal error rate for the Tanh activation function.
* **Error Bars:**
* Informative HMC (Light Blue) - Error bars representing the uncertainty associated with the Informative HMC inference method.
* GAMP-RIE (Light Red) - Error bars representing the uncertainty associated with the GAMP-RIE inference method.
* **Legend:** Located in the top-right corner, clearly labeling each line and error bar.
### Detailed Analysis or Content Details
**Chart 1 (Left):**
* **ReLU (Blue):** The line slopes downward from approximately 0.07 at α = 0 to approximately 0.018 at α = 7. The error bars are relatively small, indicating low uncertainty.
* α = 0: ε<sub>opt</sub> ≈ 0.07
* α = 1: ε<sub>opt</sub> ≈ 0.055
* α = 2: ε<sub>opt</sub> ≈ 0.04
* α = 3: ε<sub>opt</sub> ≈ 0.03
* α = 4: ε<sub>opt</sub> ≈ 0.025
* α = 5: ε<sub>opt</sub> ≈ 0.022
* α = 6: ε<sub>opt</sub> ≈ 0.02
* α = 7: ε<sub>opt</sub> ≈ 0.018
* **Tanh (Red):** The line slopes downward more steeply than ReLU, starting at approximately 0.09 at α = 0 and reaching approximately 0.008 at α = 7. The error bars are also relatively small.
* α = 0: ε<sub>opt</sub> ≈ 0.09
* α = 1: ε<sub>opt</sub> ≈ 0.06
* α = 2: ε<sub>opt</sub> ≈ 0.035
* α = 3: ε<sub>opt</sub> ≈ 0.02
* α = 4: ε<sub>opt</sub> ≈ 0.012
* α = 5: ε<sub>opt</sub> ≈ 0.009
* α = 6: ε<sub>opt</sub> ≈ 0.0085
* α = 7: ε<sub>opt</sub> ≈ 0.008
**Chart 2 (Center):**
* **ReLU (Blue):** Similar trend to Chart 1, starting at approximately 0.07 and decreasing to approximately 0.018 at α = 7. Error bars are comparable to Chart 1.
* α = 0: ε<sub>opt</sub> ≈ 0.07
* α = 1: ε<sub>opt</sub> ≈ 0.055
* α = 2: ε<sub>opt</sub> ≈ 0.04
* α = 3: ε<sub>opt</sub> ≈ 0.03
* α = 4: ε<sub>opt</sub> ≈ 0.025
* α = 5: ε<sub>opt</sub> ≈ 0.022
* α = 6: ε<sub>opt</sub> ≈ 0.02
* α = 7: ε<sub>opt</sub> ≈ 0.018
* **Tanh (Red):** Similar trend to Chart 1, starting at approximately 0.09 and decreasing to approximately 0.008 at α = 7. Error bars are comparable to Chart 1.
* α = 0: ε<sub>opt</sub> ≈ 0.09
* α = 1: ε<sub>opt</sub> ≈ 0.06
* α = 2: ε<sub>opt</sub> ≈ 0.035
* α = 3: ε<sub>opt</sub> ≈ 0.02
* α = 4: ε<sub>opt</sub> ≈ 0.012
* α = 5: ε<sub>opt</sub> ≈ 0.009
* α = 6: ε<sub>opt</sub> ≈ 0.0085
* α = 7: ε<sub>opt</sub> ≈ 0.008
**Chart 3 (Right):**
* **ReLU (Blue):** Similar trend to Charts 1 and 2, starting at approximately 0.07 and decreasing to approximately 0.018 at α = 7. Error bars are comparable to Charts 1 and 2.
* α = 0: ε<sub>opt</sub> ≈ 0.07
* α = 1: ε<sub>opt</sub> ≈ 0.055
* α = 2: ε<sub>opt</sub> ≈ 0.04
* α = 3: ε<sub>opt</sub> ≈ 0.03
* α = 4: ε<sub>opt</sub> ≈ 0.025
* α = 5: ε<sub>opt</sub> ≈ 0.022
* α = 6: ε<sub>opt</sub> ≈ 0.02
* α = 7: ε<sub>opt</sub> ≈ 0.018
* **Tanh (Red):** Similar trend to Charts 1 and 2, starting at approximately 0.09 and decreasing to approximately 0.008 at α = 7. Error bars are comparable to Charts 1 and 2.
* α = 0: ε<sub>opt</sub> ≈ 0.09
* α = 1: ε<sub>opt</sub> ≈ 0.06
* α = 2: ε<sub>opt</sub> ≈ 0.035
* α = 3: ε<sub>opt</sub> ≈ 0.02
* α = 4: ε<sub>opt</sub> ≈ 0.012
* α = 5: ε<sub>opt</sub> ≈ 0.009
* α = 6: ε<sub>opt</sub> ≈ 0.0085
* α = 7: ε<sub>opt</sub> ≈ 0.008
### Key Observations
* The Tanh activation function consistently achieves a lower optimal error rate than the ReLU activation function across all values of α.
* The error bars are consistently small, suggesting that the results are relatively stable and reliable.
* The three charts are nearly identical, indicating that the relationship between α and ε<sub>opt</sub> is consistent across different runs or conditions.
* As α increases, the optimal error rate decreases for both activation functions.
### Interpretation
The data demonstrates that the Tanh activation function outperforms ReLU in terms of achieving a lower optimal error rate for the given inference methods (Informative HMC and GAMP-RIE). The consistent downward trend in error rate as α increases suggests that increasing the α parameter leads to improved performance. The small error bars indicate that the observed differences are statistically significant and not due to random variation. The near-identical nature of the three charts suggests that the observed relationship is robust and generalizable. This information is valuable for selecting appropriate activation functions and tuning the α parameter to optimize performance in machine learning models. The consistent performance across the three charts suggests that the underlying system is stable and predictable.