## Line Graphs: ε_opt vs α for Different Activation Functions and Methods
### Overview
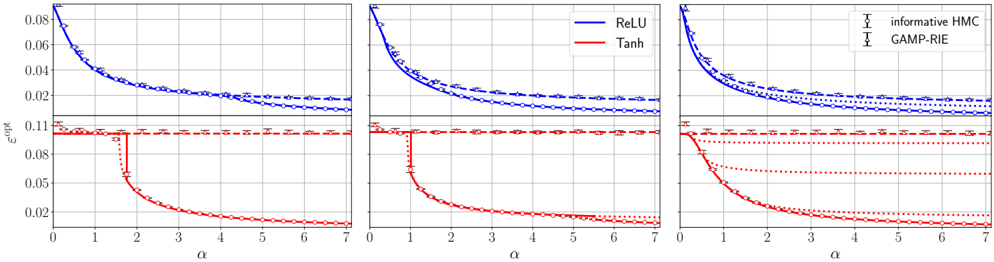
The image contains three side-by-side line graphs comparing the optimal error rate (ε_opt) as a function of a parameter α (0–7) across different activation functions and methods. Each graph uses blue and red lines to represent distinct functions/methods, with legends clarifying their identities. The graphs show trends in ε_opt as α increases, with notable differences in convergence behavior between the functions/methods.
---
### Components/Axes
- **X-axis**: Labeled α, ranging from 0 to 7 in integer increments.
- **Y-axis**: Labeled ε_opt, with values from 0.02 to 0.08 in 0.02 increments.
- **Legends**:
- **First two graphs**:
- Blue line: "ReLU"
- Red line: "Tanh"
- **Third graph**:
- Blue line: "informative HMC"
- Red line: "GAMP-RIE"
- **Markers**:
- Blue line: Circles (○)
- Red line: Crosses (✖)
---
### Detailed Analysis
#### First Graph (ReLU vs Tanh)
- **ReLU (blue)**: Starts at ε_opt ≈ 0.08 (α=0) and decreases gradually to ~0.02 by α=7. The decline is smooth and monotonic.
- **Tanh (red)**: Begins at ε_opt ≈ 0.11 (α=0), drops sharply to ~0.02 by α=2, then plateaus. The steep initial decline contrasts with ReLU’s gradual decrease.
#### Second Graph (ReLU vs Tanh)
- **ReLU (blue)**: Similar trend to the first graph but with a slightly less steep decline. Starts at ~0.08 (α=0) and reaches ~0.02 by α=7.
- **Tanh (red)**: Mirrors the first graph’s behavior: sharp drop to ~0.02 by α=2, followed by a plateau. The red line’s initial value is slightly lower (~0.105) compared to the first graph.
#### Third Graph (informative HMC vs GAMP-RIE)
- **informative HMC (blue)**: Starts at ~0.08 (α=0) and decreases to ~0.02 by α=7, with a gradual decline similar to ReLU in the first two graphs.
- **GAMP-RIE (red)**: Begins at ~0.11 (α=0), drops sharply to ~0.05 by α=2, then plateaus. The red line’s plateau is higher than in the first two graphs, suggesting a different convergence behavior.
---
### Key Observations
1. **ReLU Consistency**: Across all graphs, ReLU (or its equivalent in the third graph) shows a smooth, gradual decline in ε_opt as α increases.
2. **Tanh/GAMP-RIE Behavior**: The red lines (Tanh or GAMP-RIE) exhibit a sharp initial drop in ε_opt, followed by a plateau. The third graph’s GAMP-RIE line plateaus at a higher ε_opt (~0.05) compared to Tanh in the first two graphs (~0.02).
3. **Legend Discrepancy**: The third graph’s legend labels ("informative HMC" and "GAMP-RIE") do not align with the first two graphs’ labels ("ReLU" and "Tanh"). This suggests either a mislabeling in the image or a contextual shift in the third graph’s methodology.
4. **Convergence Differences**: ReLU-like methods achieve lower ε_opt at higher α values compared to Tanh/GAMP-RIE, which plateau earlier but at higher error rates.
---
### Interpretation
The graphs demonstrate how ε_opt varies with α for different activation functions or optimization methods. ReLU (or its equivalent) consistently reduces error more effectively as α increases, while Tanh/GAMP-RIE methods show rapid initial improvement but limited further gains. The third graph’s higher plateau for GAMP-RIE suggests potential limitations in its convergence under the tested conditions. The legend mismatch in the third graph raises questions about whether the methods or parameters differ significantly from the first two graphs, warranting further investigation into the experimental setup or labeling accuracy.