## Diagram: Bidirectional Layer Mapping (Visible-Hidden Units)
### Overview
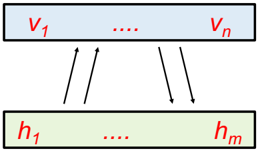
The image is a schematic diagram illustrating a bidirectional relationship between two sets of variables or units, typically representing layers in a computational model such as a neural network (e.g., a Restricted Boltzmann Machine or autoencoder). It depicts a top layer labeled with "v" variables and a bottom layer labeled with "h" variables, connected by arrows indicating bidirectional flow or interaction.
### Components/Axes
1. **Top Layer (Visible Units):**
* **Shape:** A horizontal rectangle with a light blue background.
* **Label Text:** `v₁ .... vₙ` (rendered in red).
* **Interpretation:** Represents a set of `n` visible units or variables, indexed from 1 to `n`. The ellipsis (`....`) indicates a sequence of intermediate units not explicitly drawn.
2. **Bottom Layer (Hidden Units):**
* **Shape:** A horizontal rectangle with a light green background.
* **Label Text:** `h₁ .... hₘ` (rendered in red).
* **Interpretation:** Represents a set of `m` hidden units or variables, indexed from 1 to `m`. The ellipsis (`....`) indicates a sequence of intermediate units not explicitly drawn.
3. **Connections (Arrows):**
* **Type:** Four black arrows.
* **Direction & Placement:**
* Two arrows point **upward** from the bottom (green) layer to the top (blue) layer. They are positioned on the left side of the diagram.
* Two arrows point **downward** from the top (blue) layer to the bottom (green) layer. They are positioned on the right side of the diagram.
* **Interpretation:** The arrows symbolize a bidirectional flow of information, influence, or computation between the two layers. This is characteristic of undirected graphical models or networks with feedback connections.
### Detailed Analysis
* **Spatial Layout:** The diagram is vertically stacked. The "visible" layer (`v`) is positioned above the "hidden" layer (`h`), a common convention in neural network diagrams where data flows from input (top) to processing layers (below).
* **Textual Content:** All text is in English, using standard mathematical notation with subscripts for indexing. The red color of the text contrasts with the pastel backgrounds of the boxes.
* **Symbolic Meaning:**
* `v₁, v₂, ..., vₙ`: Denotes individual elements of the first set. The use of `n` implies a finite, potentially large, count.
* `h₁, h₂, ..., hₘ`: Denotes individual elements of the second set. The use of `m` implies a finite count, which may be different from `n`.
* The ellipsis (`....`) is a critical component, explicitly indicating that the diagram is a simplified representation of a larger, potentially fully-connected system.
### Key Observations
1. **Bidirectional Connectivity:** The presence of both upward and downward arrows is the most significant feature. It indicates that the relationship between the `v` and `h` sets is not strictly feedforward; there is a reciprocal interaction.
2. **Asymmetric Arrow Placement:** The upward arrows are grouped on the left, and the downward arrows on the right. This is likely a stylistic choice to avoid visual clutter and does not imply that only specific units are connected. In the context of models like RBMs, it typically represents a fully-connected bipartite graph where every `v` unit connects to every `h` unit and vice-versa.
3. **Variable Naming Convention:** The use of `v` and `h` is a strong domain-specific cue. In machine learning, `v` commonly stands for "visible" (observed data) and `h` for "hidden" (latent features).
### Interpretation
This diagram is a canonical representation of a two-layer, undirected probabilistic model or a bidirectional neural network component. The data suggests a system where:
* The state of the visible units (`v`) influences the state of the hidden units (`h`), and the state of the hidden units simultaneously influences the visible units.
* This structure is fundamental to models designed for unsupervised learning, such as **Restricted Boltzmann Machines (RBMs)**, where the goal is to learn a probability distribution over the visible data by modeling the interactions with hidden features.
* The diagram abstracts away the specific mathematical operations (e.g., weighted sums, activation functions, energy functions) but clearly communicates the core architectural principle of bidirectional, symmetric (or asymmetric) coupling between two distinct groups of variables. The ellipsis emphasizes that the model scales to an arbitrary number of units in each layer.