## Diagram: Variable Interaction System
### Overview
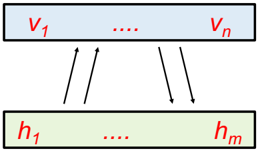
The image depicts a two-layered system with bidirectional interactions between variables. The top layer contains variables labeled `V₁` to `Vₙ`, while the bottom layer contains variables labeled `h₁` to `hₘ`. Arrows connect specific variables in the top layer to variables in the bottom layer, indicating mutual influence.
### Components/Axes
- **Top Layer**:
- Labeled `V₁` (leftmost) to `Vₙ` (rightmost), with ellipses (`...`) indicating intermediate variables.
- Background color: Light blue.
- **Bottom Layer**:
- Labeled `h₁` (leftmost) to `hₘ` (rightmost), with ellipses (`...`) indicating intermediate variables.
- Background color: Light green.
- **Arrows**:
- Two double-headed arrows connect `V₁` and `Vₙ` to `h₁` and `hₘ`, respectively.
- Arrows are black, with no explicit labels or legends.
### Detailed Analysis
- **Labels**:
- Top layer variables: `V₁`, `V₂`, ..., `Vₙ` (exact count unspecified, represented by `n`).
- Bottom layer variables: `h₁`, `h₂`, ..., `hₘ` (exact count unspecified, represented by `m`).
- **Spatial Grounding**:
- Top layer is positioned above the bottom layer.
- Arrows originate from `V₁` and `Vₙ` (top layer) and point to `h₁` and `hₘ` (bottom layer), with bidirectional flow.
- **Color Consistency**:
- No legend present; colors are used solely for layer distinction (light blue for `V`, light green for `h`).
### Key Observations
1. The system emphasizes **bidirectional relationships** between variables in the top and bottom layers.
2. The use of `n` and `m` suggests scalability, with the number of variables in each layer being variable.
3. Arrows connect only the first and last variables in each layer (`V₁` ↔ `h₁`, `Vₙ` ↔ `hₘ`), implying a focus on boundary interactions.
### Interpretation
This diagram likely represents a **feedback or coupling mechanism** between two sets of variables. The bidirectional arrows suggest that variables in the top layer (`V`) influence the bottom layer (`h`), and vice versa. This could model:
- **Neural network architectures** (e.g., encoder-decoder with feedback).
- **Control systems** where outputs affect inputs.
- **Dynamic systems** with mutual dependencies (e.g., economic models, ecological interactions).
The absence of numerical values or explicit scales indicates this is a **conceptual diagram** rather than a data-driven chart. The focus is on structural relationships rather than quantitative analysis.