# Technical Document Extraction: Norm Ratio by Model Layers
## 1. Component Isolation
* **Header/Legend:** Located in the top-left quadrant of the chart area.
* **Main Chart:** A line graph with markers plotted against a grid.
* **Axes:** Y-axis (left) representing "Norm Ratio"; X-axis (bottom) representing "Layers".
## 2. Metadata and Axis Labels
* **Y-Axis Title:** Norm Ratio
* **Y-Axis Markers:** 0.94, 0.96, 0.98, 1.00, 1.02
* **X-Axis Title:** Layers
* **X-Axis Markers:** 0, 5, 10, 15, 20, 25, 30
* **Legend [Spatial Grounding: Top-Left]:**
* **Blue Line with Circle Markers:** `Asso. Hallu./Factual Asso.`
* **Red Line with Square Markers:** `Unasso. Hallu./Factual Asso.`
---
## 3. Data Series Analysis and Trend Verification
### Series 1: Asso. Hallu./Factual Asso. (Blue Circles)
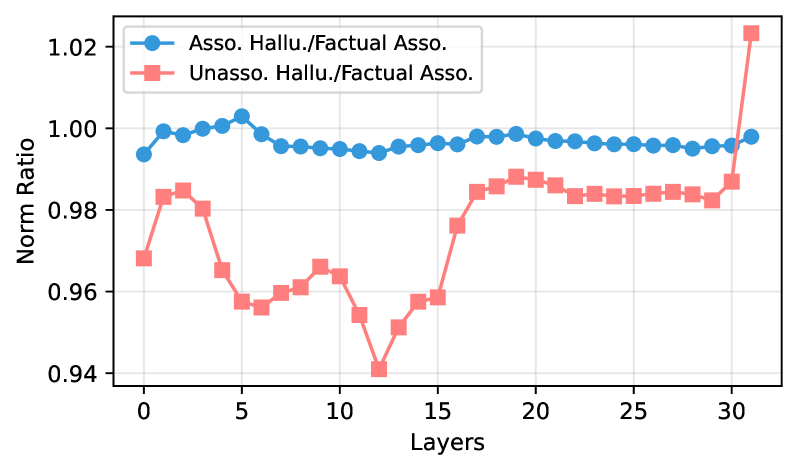
* **Visual Trend:** This series is remarkably stable. It begins slightly below 1.00, peaks very early (around Layer 5), and then maintains a nearly horizontal trajectory just below the 1.00 mark for the remainder of the layers.
* **Key Data Points (Approximate):**
* **Layer 0:** ~0.994
* **Layer 5 (Peak):** ~1.003
* **Layers 10-30:** Fluctuates minimally between 0.995 and 0.998.
* **Layer 31 (Final):** ~0.998
### Series 2: Unasso. Hallu./Factual Asso. (Red Squares)
* **Visual Trend:** This series exhibits high volatility. It starts significantly lower than the blue series, undergoes a deep "V" shaped dip reaching its lowest point at Layer 12, recovers sharply until Layer 19, plateaus, and then finishes with a dramatic upward spike at the final layer.
* **Key Data Points (Approximate):**
* **Layer 0:** ~0.968
* **Layer 5:** ~0.958
* **Layer 12 (Global Minimum):** ~0.941
* **Layer 19 (Recovery Plateau):** ~0.988
* **Layers 20-29:** Relatively stable around 0.984.
* **Layer 31 (Global Maximum/Spike):** ~1.023
---
## 4. Comparative Summary
The chart compares two types of hallucination ratios across 32 layers (0-31) of a neural network.
1. **Stability vs. Volatility:** The "Asso. Hallu." (Associated Hallucination) ratio remains consistently close to 1.00, suggesting a stable relationship with factual association throughout the model's depth. In contrast, the "Unasso. Hallu." (Unassociated Hallucination) ratio varies significantly, indicating that the middle layers (specifically around Layer 12) have a much lower norm ratio compared to the initial and final layers.
2. **Final Layer Behavior:** At the final layer (Layer 31), the "Unasso. Hallu." ratio spikes aggressively, surpassing the "Asso. Hallu." ratio for the first time in the sequence, reaching the highest value recorded on the chart (~1.023).
3. **Convergence:** Between layers 20 and 30, the two metrics are at their closest proximity prior to the final layer divergence, though the blue line remains consistently higher than the red line during this interval.