## Line Chart: Normalized Ratio of Hallucinations to Factual Associations vs. Layers
### Overview
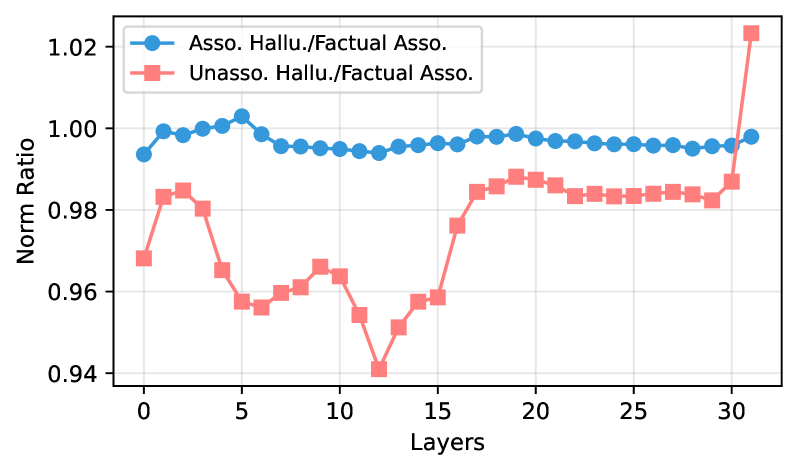
This line chart depicts the relationship between the number of layers in a model and the normalized ratio of hallucinations to factual associations. Two data series are presented: one for "Asso. Hallu./Factual Asso." (Association Hallucinations/Factual Associations) and another for "Unasso. Hallu./Factual Asso." (Unassociated Hallucinations/Factual Associations). The chart aims to illustrate how the propensity for hallucinations changes as model depth (number of layers) increases.
### Components/Axes
* **X-axis:** "Layers" - ranging from 0 to approximately 32. The scale is linear.
* **Y-axis:** "Norm Ratio" - ranging from approximately 0.94 to 1.02. The scale is linear.
* **Data Series 1:** "Asso. Hallu./Factual Asso." - represented by blue circles.
* **Data Series 2:** "Unasso. Hallu./Factual Asso." - represented by red square markers.
* **Legend:** Located in the top-left corner, clearly labeling each data series with its corresponding color.
### Detailed Analysis
**Asso. Hallu./Factual Asso. (Blue Line):**
The blue line initially starts at approximately 1.00 at Layer 0, then gently declines to a minimum of approximately 0.98 at Layer 10. It then fluctuates around 0.99-1.00 from Layers 10 to 28. A sharp increase is observed at Layer 32, reaching approximately 1.02.
* Layer 0: 1.00
* Layer 2: 1.00
* Layer 4: 0.99
* Layer 6: 0.99
* Layer 8: 0.99
* Layer 10: 0.98
* Layer 12: 0.99
* Layer 14: 0.99
* Layer 16: 0.99
* Layer 18: 0.99
* Layer 20: 0.99
* Layer 22: 0.99
* Layer 24: 0.99
* Layer 26: 0.99
* Layer 28: 0.99
* Layer 30: 1.00
* Layer 32: 1.02
**Unasso. Hallu./Factual Asso. (Red Line):**
The red line begins at approximately 0.99 at Layer 0, dips to a minimum of approximately 0.94 at Layer 12, and then gradually increases to approximately 0.99 at Layer 32.
* Layer 0: 0.99
* Layer 2: 0.99
* Layer 4: 0.98
* Layer 6: 0.97
* Layer 8: 0.97
* Layer 10: 0.96
* Layer 12: 0.94
* Layer 14: 0.96
* Layer 16: 0.97
* Layer 18: 0.98
* Layer 20: 0.98
* Layer 22: 0.98
* Layer 24: 0.98
* Layer 26: 0.98
* Layer 28: 0.99
* Layer 30: 0.99
* Layer 32: 0.99
### Key Observations
* The "Asso. Hallu./Factual Asso." ratio remains relatively stable across most layers, with a slight increase at the final layer.
* The "Unasso. Hallu./Factual Asso." ratio exhibits a more pronounced dip around Layer 12, indicating a potential reduction in unassociated hallucinations at that depth.
* The difference between the two ratios is relatively small throughout most of the range, but widens at Layer 32.
### Interpretation
The chart suggests that increasing the number of layers in the model does not necessarily lead to a significant increase in associated hallucinations, as the blue line remains relatively constant. However, the dip in the red line around Layer 12 suggests that a specific depth might reduce unassociated hallucinations. The sharp increase in the blue line at Layer 32 could indicate a point of diminishing returns or instability as the model becomes very deep. The data suggests that the type of hallucination (associated vs. unassociated) is affected differently by model depth. The widening gap at Layer 32 could mean that deeper models are more prone to *associated* hallucinations, while the effect on unassociated hallucinations is less pronounced. This could be due to the model learning spurious correlations or overfitting to the training data at greater depths. Further investigation is needed to understand the underlying causes of these trends and to determine the optimal model depth for minimizing hallucinations.