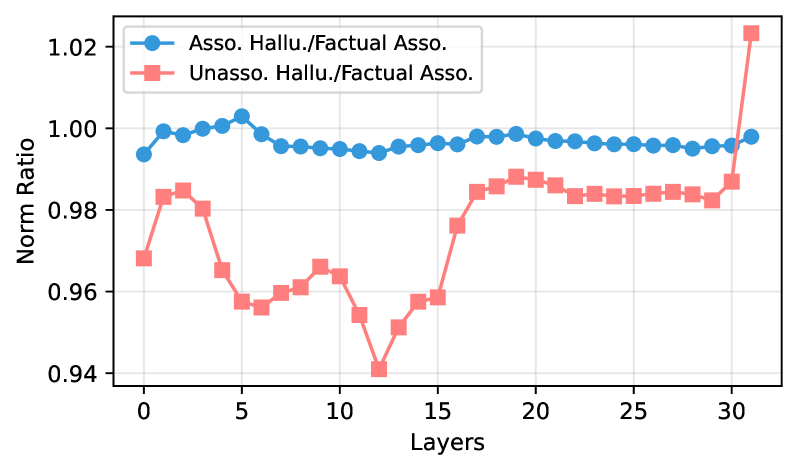
## Line Graph: Normalized Ratio of Hallucinations to Factual Associations Across Layers
### Overview
The image is a line graph comparing two data series across 31 layers (0–30). The y-axis represents a "Norm Ratio" (normalized ratio), while the x-axis represents discrete layers. Two data series are plotted:
- **Blue circles**: "Asso. Hallu./Factual Asso." (associated hallucinations to factual associations)
- **Red squares**: "Unasso. Hallu./Factual Asso." (unassociated hallucinations to factual associations)
### Components/Axes
- **X-axis (Layers)**: Discrete values from 0 to 30, labeled "Layers."
- **Y-axis (Norm Ratio)**: Continuous scale from 0.94 to 1.02, labeled "Norm Ratio."
- **Legend**: Located in the top-left corner, with blue circles for "Asso. Hallu./Factual Asso." and red squares for "Unasso. Hallu./Factual Asso."
### Detailed Analysis
#### Blue Circles ("Asso. Hallu./Factual Asso."):
- **Trend**: Starts at ~0.99 (Layer 0), peaks slightly above 1.00 (~1.005) at Layer 5, then stabilizes between 0.995–1.00 across Layers 10–30.
- **Key Points**:
- Layer 0: 0.99
- Layer 5: 1.005
- Layer 10: 0.995
- Layer 20: 0.998
- Layer 30: 0.999
#### Red Squares ("Unasso. Hallu./Factual Asso."):
- **Trend**: Starts at ~0.97 (Layer 0), dips to a minimum of 0.94 at Layer 12, then rises sharply to 1.02 at Layer 30.
- **Key Points**:
- Layer 0: 0.97
- Layer 5: 0.96
- Layer 10: 0.965
- Layer 12: 0.94
- Layer 15: 0.96
- Layer 20: 0.985
- Layer 25: 0.98
- Layer 30: 1.02
### Key Observations
1. **Stability vs. Volatility**:
- The blue series ("Asso.") remains relatively stable, fluctuating within ±0.005 of 1.00.
- The red series ("Unasso.") exhibits significant variability, with a sharp increase of 0.04 (from 0.98 to 1.02) between Layers 25 and 30.
2. **Outlier**:
- The red series reaches its lowest point (0.94) at Layer 12, a 3% deviation from its initial value.
3. **Final Layer Anomaly**:
- The red series surpasses the blue series at Layer 30, reaching 1.02, suggesting a critical shift in the unassociated ratio.
### Interpretation
- **Stability of Associated Ratios**: The blue line’s consistency implies that associated hallucinations maintain a near-1:1 ratio with factual associations across most layers, indicating robustness in this relationship.
- **Unassociated Volatility**: The red line’s erratic behavior, particularly the sharp rise at Layer 30, suggests that unassociated hallucinations are more sensitive to layer-specific changes. This could reflect systemic instability or a threshold effect at Layer 30.
- **Layer 30 Significance**: The red series’ spike to 1.02 at Layer 30 may indicate a critical layer where unassociated factors dominate, potentially disrupting the balance observed in earlier layers.
This data highlights the importance of layer-specific analysis in understanding the interplay between hallucinations and factual associations, with unassociated factors showing greater susceptibility to abrupt changes.