## Line Charts: Performance Comparison on REVEAL-bench
### Overview
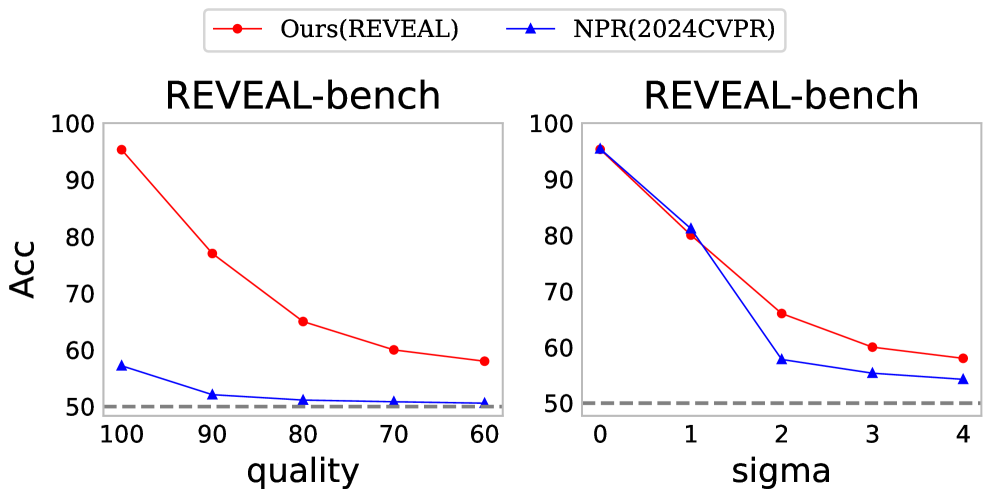
This image displays two line charts comparing the performance of two methods, "Ours(REVEAL)" and "NPR(2024CVPR)", evaluated on the "REVEAL-bench" dataset. The charts measure accuracy ("Acc") against two different variables: "quality" (left chart) and "sigma" (right chart). Both charts include a horizontal dashed gray line at Acc=50, likely representing a baseline or chance performance level.
### Components/Axes
* **Legend**: Positioned at the top center.
* **Red line with circles**: "Ours(REVEAL)"
* **Blue line with triangles**: "NPR(2024CVPR)"
* **Left Chart ("quality")**:
* **X-axis**: Labeled "quality", ranging from 100 to 60 (descending order).
* **Y-axis**: Labeled "Acc", ranging from 50 to 100.
* **Right Chart ("sigma")**:
* **X-axis**: Labeled "sigma", ranging from 0 to 4 (ascending order).
* **Y-axis**: Labeled "Acc", ranging from 50 to 100.
### Detailed Analysis
#### Left Chart: Quality vs. Accuracy
* **Trend**: Both data series show a downward trend as "quality" decreases from 100 to 60.
* **Ours(REVEAL) (Red)**: Starts at approximately 95% accuracy at quality 100. It drops to ~77% at quality 90, ~65% at quality 80, ~60% at quality 70, and ~58% at quality 60.
* **NPR(2024CVPR) (Blue)**: Starts at approximately 57% accuracy at quality 100. It drops to ~52% at quality 90, ~51% at quality 80, and plateaus near ~50.5% at qualities 70 and 60.
#### Right Chart: Sigma vs. Accuracy
* **Trend**: Both data series show a downward trend as "sigma" increases from 0 to 4.
* **Ours(REVEAL) (Red)**: Starts at approximately 95% accuracy at sigma 0. It drops to ~80% at sigma 1, ~66% at sigma 2, ~60% at sigma 3, and ~58% at sigma 4.
* **NPR(2024CVPR) (Blue)**: Starts at approximately 95% accuracy at sigma 0. It drops to ~81% at sigma 1, ~58% at sigma 2, ~55% at sigma 3, and ~54% at sigma 4.
### Key Observations
* **Performance Gap**: "Ours(REVEAL)" consistently outperforms "NPR(2024CVPR)" across all data points in the "quality" chart.
* **Robustness to Noise**: In the "sigma" chart, both models perform nearly identically at low noise levels (sigma 0 and 1). However, as noise increases (sigma 2, 3, and 4), "Ours(REVEAL)" maintains a significantly higher accuracy compared to "NPR(2024CVPR)".
* **Baseline Convergence**: In the "quality" chart, the "NPR" method approaches the 50% baseline very quickly (by quality 80), whereas "Ours" maintains a substantial margin above the baseline even at the lowest quality tested (60).
### Interpretation
The data demonstrates that "Ours(REVEAL)" is significantly more robust than the "NPR(2024CVPR)" baseline under conditions of both reduced image quality and increased noise (sigma).
* **Quality Sensitivity**: The "quality" chart suggests that the NPR method struggles to maintain accuracy even with minor reductions in quality, whereas the REVEAL method degrades more gracefully.
* **Noise Sensitivity**: The "sigma" chart indicates that while both models are highly capable under clean conditions (sigma 0), the REVEAL method is architecturally or algorithmically superior at handling higher levels of noise, as evidenced by the divergence of the two lines starting at sigma 2.
In summary, REVEAL appears to be a more stable and reliable model for the REVEAL-bench tasks when input data is degraded or noisy.