## Charts: REVEAL-bench Performance
### Overview
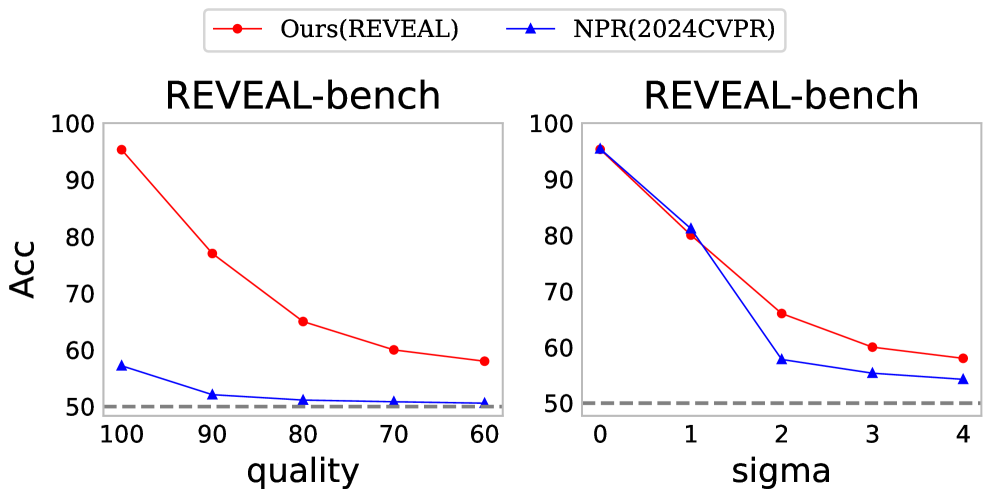
The image presents two line charts comparing the performance of "Ours(REVEAL)" and "NPR(2024CVPR)" on the REVEAL-bench dataset. The left chart shows accuracy (ACC) versus quality, while the right chart shows accuracy versus sigma. Both charts include a horizontal dashed line at an accuracy of 50.
### Components/Axes
* **Left Chart:**
* X-axis: "quality" ranging from 100 to 60.
* Y-axis: "ACC" (Accuracy) ranging from 100 to 50.
* Data Series:
* "Ours(REVEAL)" - Red line with circular markers.
* "NPR(2024CVPR)" - Blue line with triangular markers.
* Horizontal dashed line at y = 50.
* **Right Chart:**
* X-axis: "sigma" ranging from 0 to 4.
* Y-axis: "ACC" (Accuracy) ranging from 100 to 50.
* Data Series:
* "Ours(REVEAL)" - Red line with circular markers.
* "NPR(2024CVPR)" - Blue line with triangular markers.
* Horizontal dashed line at y = 50.
* **Legend:** Located at the top-right of both charts.
* Red circle: "Ours(REVEAL)"
* Blue triangle: "NPR(2024CVPR)"
### Detailed Analysis or Content Details
**Left Chart (Accuracy vs. Quality):**
* **Ours(REVEAL):** The red line slopes downward.
* At quality = 100, ACC ≈ 95.
* At quality = 90, ACC ≈ 80.
* At quality = 80, ACC ≈ 65.
* At quality = 70, ACC ≈ 60.
* At quality = 60, ACC ≈ 58.
* **NPR(2024CVPR):** The blue line is relatively flat.
* At quality = 100, ACC ≈ 55.
* At quality = 90, ACC ≈ 55.
* At quality = 80, ACC ≈ 55.
* At quality = 70, ACC ≈ 55.
* At quality = 60, ACC ≈ 55.
**Right Chart (Accuracy vs. Sigma):**
* **Ours(REVEAL):** The red line slopes downward, but the decrease is less pronounced than in the left chart.
* At sigma = 0, ACC ≈ 95.
* At sigma = 1, ACC ≈ 85.
* At sigma = 2, ACC ≈ 65.
* At sigma = 3, ACC ≈ 60.
* At sigma = 4, ACC ≈ 55.
* **NPR(2024CVPR):** The blue line slopes downward more steeply initially, then flattens out.
* At sigma = 0, ACC ≈ 90.
* At sigma = 1, ACC ≈ 80.
* At sigma = 2, ACC ≈ 60.
* At sigma = 3, ACC ≈ 55.
* At sigma = 4, ACC ≈ 55.
### Key Observations
* In both charts, "Ours(REVEAL)" consistently outperforms "NPR(2024CVPR)" at all measured values.
* The performance of "Ours(REVEAL)" is more sensitive to changes in "quality" than to changes in "sigma".
* The performance of "NPR(2024CVPR)" is relatively stable with respect to "quality".
* The accuracy of both methods degrades as "quality" decreases and as "sigma" increases.
### Interpretation
The data suggests that the "Ours(REVEAL)" method is more effective than "NPR(2024CVPR)" on the REVEAL-bench dataset. The left chart indicates that the accuracy of "Ours(REVEAL)" is significantly affected by the "quality" of the input, while the accuracy of "NPR(2024CVPR)" remains relatively constant. The right chart shows that increasing "sigma" (likely representing noise or uncertainty) reduces the accuracy of both methods, but the impact is more pronounced on "NPR(2024CVPR)" initially.
The horizontal dashed line at 50 likely represents a baseline or threshold for acceptable performance. Both methods perform above this threshold for most values of "quality" and "sigma", but the performance of "NPR(2024CVPR)" approaches this threshold as "sigma" increases.
The relationship between the two charts suggests that "quality" and "sigma" may represent different aspects of the input data. "Quality" could refer to the clarity or completeness of the data, while "sigma" could represent the level of noise or uncertainty. The fact that "Ours(REVEAL)" is more sensitive to "quality" suggests that it relies on high-quality data to achieve optimal performance.