\n
## Line Charts: REVEAL-bench Performance Comparison
### Overview
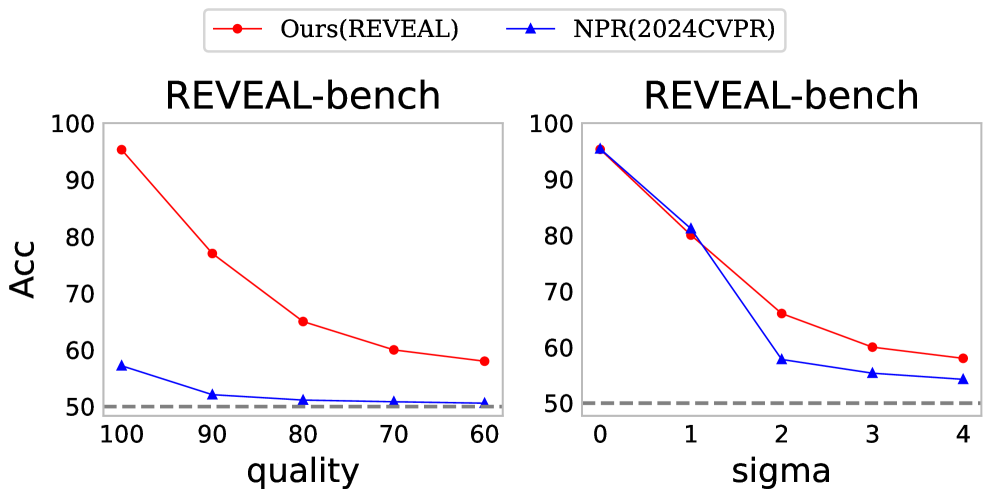
The image displays two side-by-side line charts comparing the performance of two methods, "Ours(REVEAL)" and "NPR(2024CVPR)", on the "REVEAL-bench" benchmark. The charts plot accuracy ("ACC") against two different independent variables: "quality" (left chart) and "sigma" (right chart). A legend is positioned at the top center of the entire figure.
### Components/Axes
* **Legend:** Located at the top center, spanning both charts.
* Red line with circular markers: `Ours(REVEAL)`
* Blue line with triangular markers: `NPR(2024CVPR)`
* **Left Chart:**
* **Title:** `REVEAL-bench` (centered above the plot area).
* **Y-axis:** Label is `ACC`. Scale ranges from 50 to 100, with major ticks at 50, 60, 70, 80, 90, 100.
* **X-axis:** Label is `quality`. The scale is descending, with major ticks at 100, 90, 80, 70, 60.
* **Baseline:** A dashed gray horizontal line is present at y=50.
* **Right Chart:**
* **Title:** `REVEAL-bench` (centered above the plot area).
* **Y-axis:** Label is `ACC`. Scale is identical to the left chart (50 to 100).
* **X-axis:** Label is `sigma`. Scale is ascending, with major ticks at 0, 1, 2, 3, 4.
* **Baseline:** A dashed gray horizontal line is present at y=50.
### Detailed Analysis
**Left Chart (ACC vs. quality):**
* **Trend Verification:**
* **Ours(REVEAL) [Red Line]:** Shows a strong, consistent downward slope. Accuracy decreases significantly as the `quality` value decreases (moves from 100 to 60).
* **NPR(2024CVPR) [Blue Line]:** Shows a very shallow downward slope, remaining relatively flat and close to the baseline.
* **Data Points (Approximate):**
* **quality=100:** Ours ≈ 96, NPR ≈ 57
* **quality=90:** Ours ≈ 77, NPR ≈ 52
* **quality=80:** Ours ≈ 65, NPR ≈ 51
* **quality=70:** Ours ≈ 60, NPR ≈ 51
* **quality=60:** Ours ≈ 58, NPR ≈ 50
**Right Chart (ACC vs. sigma):**
* **Trend Verification:**
* **Ours(REVEAL) [Red Line]:** Shows a downward slope that is steepest between sigma=0 and sigma=2, then becomes more gradual.
* **NPR(2024CVPR) [Blue Line]:** Also shows a downward slope, with a very steep drop between sigma=1 and sigma=2, after which it flattens.
* **Data Points (Approximate):**
* **sigma=0:** Ours ≈ 96, NPR ≈ 96 (lines overlap)
* **sigma=1:** Ours ≈ 80, NPR ≈ 81
* **sigma=2:** Ours ≈ 66, NPR ≈ 58
* **sigma=3:** Ours ≈ 60, NPR ≈ 55
* **sigma=4:** Ours ≈ 58, NPR ≈ 54
### Key Observations
1. **Performance Gap:** The "Ours(REVEAL)" method consistently outperforms "NPR(2024CVPR)" in terms of accuracy across all tested conditions in both charts, except at sigma=0 and sigma=1 in the right chart where performance is nearly identical.
2. **Sensitivity to Quality:** The left chart reveals that "Ours(REVEAL)" is highly sensitive to the `quality` parameter, with accuracy dropping by approximately 38 percentage points as quality decreases from 100 to 60. In contrast, "NPR(2024CVPR)" is largely insensitive, dropping only about 7 points over the same range.
3. **Sensitivity to Sigma:** Both methods degrade as `sigma` increases. The degradation is most severe for both between sigma=1 and sigma=2. After sigma=2, the rate of decline slows for both, but "Ours(REVEAL)" maintains a consistent lead of about 5-8 accuracy points.
4. **Baseline Proximity:** In the left chart, the "NPR(2024CVPR)" method's performance hovers just above the 50% baseline (random guess level) for most quality values, indicating very limited effectiveness under those conditions.
### Interpretation
The data suggests a fundamental trade-off and difference in robustness between the two methods.
* **The "Ours(REVEAL)" method** appears to be a higher-capacity model that achieves superior peak performance (at high quality/low sigma) but is more susceptible to performance degradation as input conditions worsen (lower quality, higher sigma). Its steep decline in the left chart indicates its effectiveness is heavily dependent on high-quality input data.
* **The "NPR(2024CVPR)" method** demonstrates lower peak performance but greater stability, particularly against variations in the `quality` parameter. Its flat line in the left chart suggests it may be a simpler or more regularized model that is less affected by input quality but also cannot leverage high-quality inputs to achieve high accuracy.
* **The sigma parameter** appears to represent a form of noise or difficulty scaling that negatively impacts both models. The fact that both models start at the same point (sigma=0) and then diverge suggests that "Ours(REVEAL)" has a better inherent mechanism for handling this specific type of perturbation, allowing it to maintain a performance advantage as difficulty increases.
In summary, the charts position "Ours(REVEAL)" as the more powerful but sensitive method, while "NPR(2024CVPR)" is a more stable but lower-performance baseline. The choice between them would depend on whether the application prioritizes maximum accuracy under ideal conditions or consistent, albeit lower, performance across a wider range of input qualities.