## Chart: Efficiency vs. Node Size
### Overview
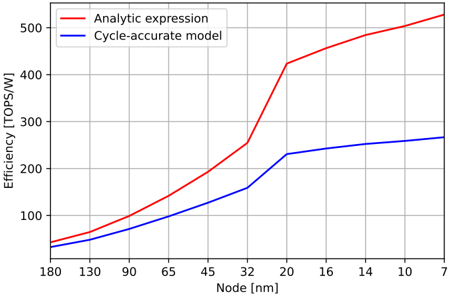
The image is a line chart comparing the efficiency (TOPS/W) of two models, "Analytic expression" and "Cycle-accurate model", across different node sizes (nm). The x-axis represents the node size in nanometers (nm), ranging from 180nm to 7nm. The y-axis represents efficiency in TOPS/W, ranging from 0 to 500.
### Components/Axes
* **Title:** There is no explicit title on the chart.
* **X-axis:**
* Label: "Node [nm]"
* Scale: 180, 130, 90, 65, 45, 32, 20, 16, 14, 10, 7
* **Y-axis:**
* Label: "Efficiency [TOPS/W]"
* Scale: 0, 100, 200, 300, 400, 500
* **Legend:** Located in the top-left corner.
* Red line: "Analytic expression"
* Blue line: "Cycle-accurate model"
### Detailed Analysis
* **Analytic expression (Red line):**
* Trend: Generally increasing as node size decreases.
* Data points:
* 180 nm: ~50 TOPS/W
* 130 nm: ~60 TOPS/W
* 90 nm: ~90 TOPS/W
* 65 nm: ~130 TOPS/W
* 45 nm: ~180 TOPS/W
* 32 nm: ~250 TOPS/W
* 20 nm: ~420 TOPS/W
* 16 nm: ~450 TOPS/W
* 14 nm: ~460 TOPS/W
* 10 nm: ~480 TOPS/W
* 7 nm: ~520 TOPS/W
* **Cycle-accurate model (Blue line):**
* Trend: Generally increasing as node size decreases, but at a slower rate than the "Analytic expression".
* Data points:
* 180 nm: ~30 TOPS/W
* 130 nm: ~40 TOPS/W
* 90 nm: ~60 TOPS/W
* 65 nm: ~80 TOPS/W
* 45 nm: ~100 TOPS/W
* 32 nm: ~130 TOPS/W
* 20 nm: ~230 TOPS/W
* 16 nm: ~240 TOPS/W
* 14 nm: ~245 TOPS/W
* 10 nm: ~255 TOPS/W
* 7 nm: ~270 TOPS/W
### Key Observations
* The "Analytic expression" model consistently shows higher efficiency than the "Cycle-accurate model" across all node sizes.
* The efficiency of both models increases as the node size decreases.
* The "Analytic expression" model experiences a more significant increase in efficiency between 32nm and 20nm compared to the "Cycle-accurate model".
### Interpretation
The chart demonstrates the relationship between node size and efficiency for two different models. The data suggests that smaller node sizes generally lead to higher efficiency in both models. The "Analytic expression" model appears to be more sensitive to changes in node size, exhibiting a steeper increase in efficiency as node size decreases compared to the "Cycle-accurate model". This could indicate that the "Analytic expression" model is better optimized for smaller node sizes or that it benefits more from the advancements in smaller node technologies. The significant jump in efficiency for the "Analytic expression" model between 32nm and 20nm could be attributed to a specific technological breakthrough or optimization that was more effectively utilized by this model.