# Technical Document Extraction: Aggregation-aware RL Training Performance
## Main Title
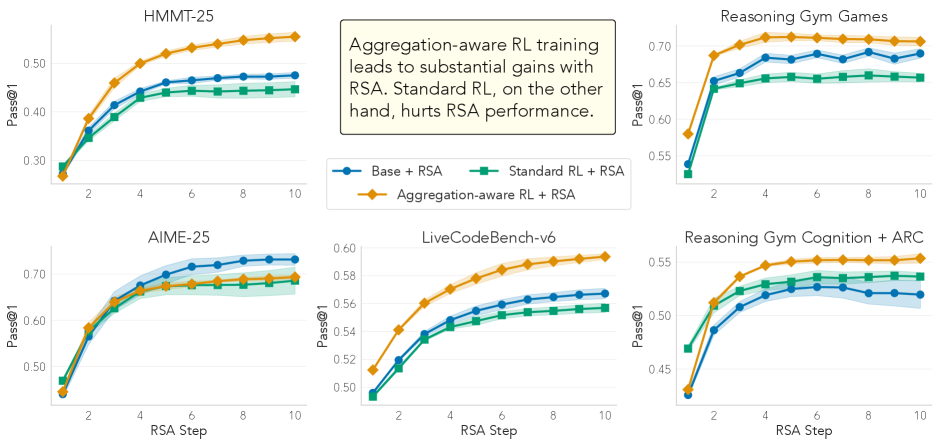
**Aggregation-aware RL training leads to substantial gains with RSA. Standard RL, on the other hand, hurts RSA performance.**
---
### Chart Structure
- **Grid Layout**: 6 charts arranged in 2 rows × 3 columns.
- **Axes**:
- **X-axis**: "RSA Step" (values: 2, 4, 6, 8, 10)
- **Y-axis**: "Pass@1" (ranging from ~0.3 to ~0.7 depending on dataset)
- **Legend**:
- **Position**: Center of the grid (spatial grounding: [x_center, y_center])
- **Labels**:
- **Blue**: Base + RSA
- **Green**: Standard RL + RSA
- **Orange**: Aggregation-aware RL + RSA
---
### Chart Analysis by Dataset
#### 1. HMMT-25
- **Title**: HMMT-25
- **Trends**:
- **Base + RSA (Blue)**: Starts at ~0.3, increases steadily to ~0.48 by step 10.
- **Standard RL + RSA (Green)**: Flat line at ~0.45.
- **Aggregation-aware RL + RSA (Orange)**: Sharp upward trend from ~0.3 to ~0.55.
- **Key Insight**: Aggregation-aware RL + RSA outperforms others by ~10% at step 10.
#### 2. Reasoning Gym Games
- **Title**: Reasoning Gym Games
- **Trends**:
- **Base + RSA (Blue)**: Starts at ~0.65, plateaus at ~0.68.
- **Standard RL + RSA (Green)**: Flat line at ~0.65.
- **Aggregation-aware RL + RSA (Orange)**: Starts at ~0.65, rises to ~0.72.
- **Key Insight**: Aggregation-aware RL + RSA achieves ~7% higher performance than Standard RL + RSA.
#### 3. AIME-25
- **Title**: AIME-25
- **Trends**:
- **Base + RSA (Blue)**: Starts at ~0.5, increases to ~0.7.
- **Standard RL + RSA (Green)**: Flat line at ~0.65.
- **Aggregation-aware RL + RSA (Orange)**: Steeper rise from ~0.5 to ~0.7.
- **Key Insight**: Aggregation-aware RL + RSA matches Base + RSA performance while outperforming Standard RL + RSA.
#### 4. LiveCodeBench-v6
- **Title**: LiveCodeBench-v6
- **Trends**:
- **Base + RSA (Blue)**: Starts at ~0.5, rises to ~0.62.
- **Standard RL + RSA (Green)**: Flat line at ~0.58.
- **Aggregation-aware RL + RSA (Orange)**: Steeper ascent from ~0.5 to ~0.65.
- **Key Insight**: Aggregation-aware RL + RSA gains ~7% over Standard RL + RSA.
#### 5. Reasoning Gym Cognition + ARC
- **Title**: Reasoning Gym Cognition + ARC
- **Trends**:
- **Base + RSA (Blue)**: Starts at ~0.45, plateaus at ~0.52.
- **Standard RL + RSA (Green)**: Flat line at ~0.5.
- **Aggregation-aware RL + RSA (Orange)**: Sharp rise from ~0.45 to ~0.55.
- **Key Insight**: Aggregation-aware RL + RSA achieves ~10% higher performance than Standard RL + RSA.
---
### Cross-Chart Observations
1. **Legend Consistency**:
- All charts use the same color coding (blue/green/orange) as the central legend.
- No discrepancies between line colors and legend labels.
2. **Performance Pattern**:
- **Aggregation-aware RL + RSA** consistently outperforms other methods across all datasets.
- **Standard RL + RSA** shows minimal or no improvement over baseline (Base + RSA) in most cases.
3. **RSA Step Impact**:
- Performance improves with increasing RSA steps (steps 2–10) for all methods.
- Aggregation-aware RL + RSA demonstrates the steepest learning curve.
---
### Conclusion
Aggregation-aware RL training with RSA significantly enhances performance compared to Standard RL + RSA across diverse datasets. The orange line (Aggregation-aware RL + RSA) dominates in all charts, validating the main title's claim.