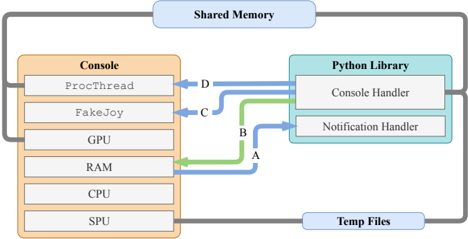
## System Architecture Diagram: Console-Python Library Interaction
### Overview
This image is a technical system architecture diagram illustrating the data flow and interaction between a "Console" system and a "Python Library." The diagram uses labeled blocks, directional arrows, and external storage elements to depict a software/hardware interface, likely for a gaming console or embedded system. The primary language is English.
### Components/Axes
The diagram is structured into four main regions:
1. **Header Region (Top):** A single block labeled **"Shared Memory"** spans the top, connected to both main system blocks.
2. **Main Chart Region (Center):** Contains two primary blocks connected by directional arrows.
* **Left Block: "Console"** (Orange background). Contains a vertical stack of six sub-components:
* `ProcThread`
* `FakeJoy`
* `GPU`
* `RAM`
* `CPU`
* `SPU`
* **Right Block: "Python Library"** (Teal background). Contains two sub-components:
* `Console Handler`
* `Notification Handler`
* **Data Flow Arrows:** Four labeled arrows show directional data flow from the Console to the Python Library.
* **Arrow A (Green):** Originates from `RAM`, points to `Console Handler`.
* **Arrow B (Green):** Originates from `RAM`, points to `Notification Handler`.
* **Arrow C (Blue):** Originates from `FakeJoy`, points to `Console Handler`.
* **Arrow D (Blue):** Originates from `ProcThread`, points to `Console Handler`.
3. **Footer Region (Bottom):** A single block labeled **"Temp Files"** spans the bottom, connected to both main system blocks.
4. **External Connections:** Both the "Console" and "Python Library" blocks have connections to the "Shared Memory" (top) and "Temp Files" (bottom) blocks.
### Detailed Analysis
* **Data Flow Mapping:**
* The `RAM` component of the Console is the source for two distinct data streams (A & B), feeding both handlers in the Python Library. This suggests RAM is a central data source for monitoring or control.
* The `ProcThread` (Process Thread) and `FakeJoy` (likely a joystick/input emulator) components have dedicated, single-destination data streams (D & C, respectively) going only to the `Console Handler`.
* The `Console Handler` is the primary data sink, receiving input from three Console sources (`RAM`, `FakeJoy`, `ProcThread`).
* The `Notification Handler` receives data only from `RAM`.
* **Color Coding:** The arrows are color-coded. Green arrows (A, B) originate from `RAM`. Blue arrows (C, D) originate from `FakeJoy` and `ProcThread`. This likely signifies different data types, protocols, or priorities (e.g., green for memory-mapped data, blue for event-driven signals).
* **Storage Layers:** The system interfaces with two shared storage layers:
* **Shared Memory:** Positioned at the top, implying high-speed, low-latency inter-process communication.
* **Temp Files:** Positioned at the bottom, implying slower, persistent, or scratch storage.
### Key Observations
1. **Asymmetric Data Flow:** All data flow is unidirectional, from the Console to the Python Library. There are no return arrows, suggesting the Python Library acts as a passive monitor, logger, or analysis tool rather than an active controller in this specific view.
2. **Central Role of RAM:** The `RAM` module is the only Console component with multiple outgoing data paths (to both handlers), highlighting its critical role as a data hub.
3. **Handler Specialization:** The `Console Handler` is a general-purpose data collector (3 inputs), while the `Notification Handler` appears specialized, listening only to RAM-based notifications or state changes.
4. **Isolated Components:** The `GPU`, `CPU`, and `SPU` (Sound Processing Unit) are shown within the Console but have no direct data flow arrows to the Python Library in this diagram. Their interaction is presumably indirect, via Shared Memory or Temp Files.
### Interpretation
This diagram models a **telemetry or debugging interface** for a console system. The Python Library likely runs on a host PC or separate core, passively collecting real-time data from the target console for analysis, visualization, or logging.
* **System Purpose:** The setup allows for non-invasive monitoring. The "FakeJoy" component suggests input simulation or recording, while "ProcThread" indicates process-level monitoring. The Python Library's handlers process this stream of system state (from RAM) and events (from input/threads).
* **Architectural Insight:** The design separates concerns: the Console handles real-time execution, while the Python Library handles data aggregation and higher-level processing. The use of Shared Memory and Temp Files provides flexible, tiered data access—fast for live analysis (Shared Memory) and persistent for post-mortem analysis (Temp Files).
* **Notable Absence:** The lack of control arrows from the Python Library back to the Console implies this is a **read-only monitoring system**. If control were possible, additional arrows would likely point from the handlers to components like `FakeJoy` or `ProcThread`.
* **Underlying Narrative:** This is a classic instrumentation pattern for performance profiling, bug reproduction (via FakeJoy input logging), or system health monitoring in embedded or gaming environments. The Python ecosystem is being leveraged for its rich data analysis and visualization libraries to make sense of the raw console telemetry.