## Multi-Panel Line Chart: Evaluation on Task (Continual Learning Benchmark)
### Overview
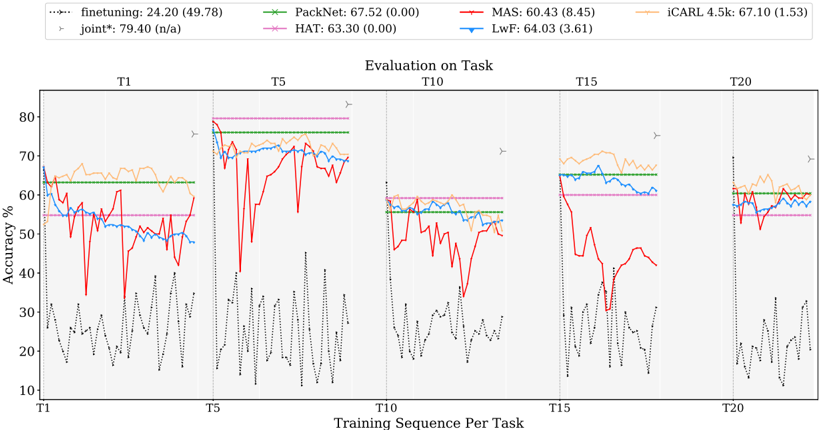
This image displays a multi-panel line chart comparing the performance (Accuracy %) of seven different machine learning models across five distinct training sequence checkpoints (T1, T5, T10, T15, T20). The chart illustrates the stability and accuracy of these models as they are evaluated on tasks throughout a continual learning process.
### Components/Axes
* **Y-Axis:** Labeled "Accuracy %". The scale ranges from 10 to 80+.
* **X-Axis (Global):** Labeled "Training Sequence Per Task". The chart is divided into five vertical panels, each representing a specific training checkpoint: T1, T5, T10, T15, and T20.
* **Legend (Top):** Located at the top of the image, defining the seven models:
* **finetuning:** Black dotted line. Value: 24.20 (49.78)
* **PackNet:** Green line with 'x' markers. Value: 67.52 (0.00)
* **MAS:** Red solid line. Value: 60.43 (8.45)
* **iCARL 4.5k:** Light orange solid line. Value: 67.10 (1.53)
* **joint*:** Grey line with '>' markers. Value: 79.40 (n/a)
* **HAT:** Magenta dashed line. Value: 63.30 (0.00)
* **LwF:** Blue solid line. Value: 64.03 (3.61)
### Detailed Analysis
The chart is segmented into five panels (T1 through T20). Within each panel, the x-axis represents the evaluation progression, and the y-axis represents accuracy.
**Trend Verification by Model:**
* **`joint*` (Grey >):** Consistently the highest performing model. It appears as a single point or short segment at the top of each panel, indicating it serves as the upper-bound performance baseline.
* **`PackNet` (Green x):** Exhibits a perfectly flat, horizontal trend across all panels. It maintains a stable accuracy level, suggesting no performance degradation over time.
* **`HAT` (Magenta dashed):** Similar to `PackNet`, this model maintains a flat, horizontal trend, indicating high stability.
* **`iCARL 4.5k` (Light orange):** Shows a relatively high, stable trend, though it exhibits minor fluctuations compared to `PackNet` and `HAT`.
* **`LwF` (Blue):** Starts at a high accuracy level but shows a slight downward trend or fluctuation as the evaluation progresses within each panel.
* **`MAS` (Red):** Highly volatile. In every panel, the line shows sharp, significant drops followed by partial recoveries. This indicates instability in the model's performance.
* **`finetuning` (Black dotted):** Consistently the lowest performing model. It exhibits extreme volatility, with accuracy frequently dropping to the 10-20% range and spiking, indicating severe "catastrophic forgetting."
**Panel-Specific Observations:**
* **T1 Panel:** `joint*` is at the top (~68%). `PackNet` and `iCARL` are clustered near 63%. `finetuning` is at the bottom, fluctuating between 15% and 40%.
* **T5 Panel:** `joint*` is at the top (~79%). `PackNet` and `HAT` are stable at ~76%. `MAS` shows a dramatic drop from ~78% down to ~40% before recovering.
* **T10 Panel:** `joint*` is at the top (~63%). `PackNet` and `HAT` are stable at ~55%. `MAS` shows significant volatility, dropping as low as ~35%.
* **T15 Panel:** `joint*` is at the top (~65%). `PackNet` and `HAT` are stable at ~60%. `MAS` shows a sharp drop to ~30% before recovering.
* **T20 Panel:** `joint*` is at the top (~69%). `PackNet` and `HAT` are stable at ~60%. `finetuning` remains highly volatile at the bottom.
### Key Observations
* **Stability vs. Plasticity:** `PackNet` and `HAT` demonstrate superior stability (flat lines), whereas `finetuning` and `MAS` demonstrate poor stability, characterized by high volatility and low accuracy.
* **Catastrophic Forgetting:** The `finetuning` model is the most susceptible to catastrophic forgetting, as evidenced by its consistently low and erratic performance across all training sequences.
* **Performance Ceiling:** The `joint*` model consistently outperforms all other methods, acting as the "oracle" or theoretical maximum accuracy for the given tasks.
### Interpretation
This chart is a classic visualization of the "Stability-Plasticity Dilemma" in Continual Learning.
1. **The "Oracle" Baseline:** The `joint*` model represents the performance achievable if the model had access to all data simultaneously (offline learning). It provides the ceiling that other models strive to reach.
2. **Zero-Forgetting Models:** `PackNet` and `HAT` are clearly designed for architectural stability. Their flat lines indicate that they do not "forget" previous tasks as they learn new ones, though their absolute accuracy is lower than the `joint*` baseline.
3. **Catastrophic Forgetting:** The `finetuning` and `MAS` models suffer significantly from catastrophic forgetting. The sharp, jagged drops in the `MAS` and `finetuning` lines suggest that as these models learn new tasks, they overwrite the weights necessary for previous tasks, leading to sudden performance collapses.
4. **Practical Implications:** If a deployment requires consistent performance, `PackNet` or `HAT` are preferable despite lower peak accuracy. If the system can tolerate volatility, `iCARL` or `LwF` might be considered, though they still show signs of degradation compared to the stable models.