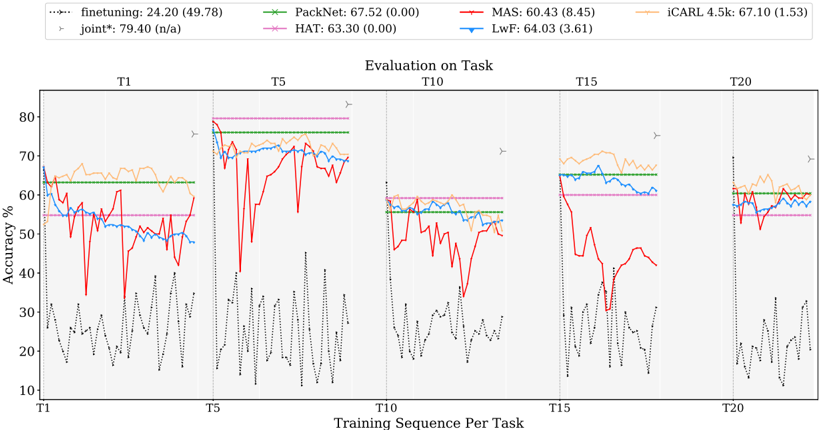
## Line Chart: Evaluation on Task
### Overview
The image presents a line chart illustrating the accuracy performance of several machine learning models across different tasks (T1 to T20) during a training sequence. The chart displays accuracy percentages on the y-axis against the training sequence per task on the x-axis. A legend at the top identifies each model with its corresponding color and initial accuracy score (with standard deviation in parentheses).
### Components/Axes
* **Title:** "Evaluation on Task" (centered at the top)
* **X-axis:** "Training Sequence Per Task" with markers at T1, T5, T10, T15, and T20.
* **Y-axis:** "Accuracy %" ranging from 10 to 80.
* **Legend:** Located at the top of the chart, horizontally aligned.
* finetuning: (green dotted line) 24.20 (49.78)
* PackNet: (dark green dashed line) 67.52 (0.00)
* MAS: (red solid line) 60.43 (8.45)
* iCARL 4.5k: (orange solid line) 67.10 (1.53)
* joint*: (purple dashed line) 79.40 (n/a)
* HAT: (magenta dotted line) 63.30 (0.00)
* LwF: (blue solid line) 64.03 (3.61)
### Detailed Analysis
The chart is divided into five sections, each representing the evaluation at tasks T1, T5, T10, T15, and T20.
* **finetuning (green dotted):** Starts around 62% at T1, fluctuates wildly between approximately 15% and 75% throughout the training sequence, ending around 58% at T20.
* **PackNet (dark green dashed):** Begins at approximately 65% at T1, exhibits significant fluctuations, dropping to around 20% at T5, then rising to around 70% at T10, falling again to around 20% at T15, and ending around 50% at T20.
* **MAS (red solid):** Starts around 60% at T1, shows a dip to around 40% at T5, rises to around 70% at T10, drops to around 30% at T15, and ends around 55% at T20.
* **iCARL 4.5k (orange solid):** Starts around 65% at T1, remains relatively stable between 60% and 70% throughout the training sequence, with a slight dip at T15, and ends around 63% at T20.
* **joint* (purple dashed):** Starts around 75% at T1, remains relatively stable between 70% and 80% throughout the training sequence, with a slight dip at T15, and ends around 75% at T20.
* **HAT (magenta dotted):** Starts around 60% at T1, fluctuates significantly, dropping to around 20% at T5, rising to around 70% at T10, falling again to around 20% at T15, and ending around 50% at T20.
* **LwF (blue solid):** Starts around 65% at T1, remains relatively stable between 60% and 70% throughout the training sequence, with a slight dip at T15, and ends around 63% at T20.
### Key Observations
* The "joint*" model consistently exhibits the highest accuracy throughout the training sequence, remaining above 70% for most tasks.
* "finetuning" and "PackNet" show the most volatile performance, with large fluctuations in accuracy.
* "iCARL 4.5k", "LwF" and "joint*" demonstrate relatively stable performance across all tasks.
* The accuracy of most models tends to dip around T5 and T15, suggesting potential challenges in learning at those specific tasks.
### Interpretation
The chart demonstrates the performance of different continual learning algorithms as they are exposed to a sequence of tasks. The "joint*" model appears to be the most robust, maintaining high accuracy throughout the training process. The high variability in "finetuning" and "PackNet" suggests they are more susceptible to catastrophic forgetting or require more careful tuning. The relatively stable performance of "iCARL 4.5k", "LwF" and "joint*" indicates their effectiveness in mitigating catastrophic forgetting. The dips in accuracy at T5 and T15 could indicate tasks that are particularly challenging or require significant adaptation from the models. The standard deviation values provided in the legend suggest varying degrees of consistency in the model's performance. The "n/a" value for the standard deviation of "joint*" may indicate that it was not calculated or is not applicable. Overall, the chart provides valuable insights into the strengths and weaknesses of different continual learning approaches.